











Why cannabis lighting should be measured in photons, not hype
A grow light is not good because it is LED, HID, or expensive. It is good if it delivers the right photon density across the canopy, for the right duration, at a heat load and electricity cost the room can handle. That is the correction most lighting guides still miss.
This matters because plants do not read marketing copy. They respond to photons, timing, temperature, and leaf-level stress. Spectrum matters, yes, but much less than many claims suggest once baseline intensity and coverage are in place. Bruce Bugbee at Utah State University has hammered this point for years in extension talks and controlled-environment lectures: growers often obsess over spectral fine-tuning while failing to measure how many usable photons actually reach leaves. That is backwards.
ePAR Extended photosynthetically active radiation. It expands photon accounting beyond the classic 400-700 nm PAR band to include far-red photons out to 750 nm when they contribute to photosynthesis.
Photosynthesis is driven mainly by photons in the 400-700 nm range, the classic PAR band. Newer horticultural discussions sometimes extend that to ePAR, out to 750 nm, because far-red can contribute under some conditions. Even so, far-red and UV are usually secondary tools. They do not rescue weak intensity, poor uniformity, or a fixture that dumps more heat into the room than the HVAC system can remove.
The common mistakes in grow-light advice
The first bad habit is comparing lights by label type instead of canopy performance. “LED vs HPS” is not a useful question by itself. A weak LED can underperform a well-run HPS setup; a high-efficacy LED can outperform old HID systems by a wide margin. Fixture geometry, optics, dimming range, hanging height, and room design all change outcomes.
| Fixture type | Typical efficacy in article | Implication |
|---|---|---|
| Double-ended HPS | 1.6-1.9 µmol/J | Lower photon output per watt than strong LED |
| Strong modern LED | Exceeds 3.0 µmol/J | Higher photon output per watt |
| DLC 2025 minimum for many horticultural luminaires | 2.30 µmol/J | Useful current efficiency floor |
The second mistake is treating wattage as if it were yield. Wattage is electricity consumed, not light delivered. Two 600 W fixtures can produce very different photon outputs if one runs at 1.6 µmol/J and another at 3.0 µmol/J. Using the 2024 DOE SSL and DLC benchmark ranges, a double-ended HPS might land around 1.6-1.9 µmol/J, while strong modern LED fixtures can exceed 3.0 µmol/J. Same input power. Very different photon budget.
The third is fixed hanging-height advice. Articles that say “hang this fixture 18 inches above the canopy” without mentioning target PPFD, optics, plant density, or dimmer setting are giving decorative advice, not agronomy. Michigan State University extension materials associated with Erik Runkle and Roberto Lopez make the actual relationship clear: raise the light and intensity drops, but uniformity often improves; lower it and center-canopy hot spots become more likely. Bleaching and photoinhibition are usually placement and intensity errors, not proof that a fixture category is wrong.
Then there is the “LEDs run cool” myth. Purdue, Cornell CEA, and DOE materials all make the distinction that many grow guides blur: LEDs emit less radiant heat toward leaves than HID, but almost all input power still ends up as heat somewhere in the room. The advantage is heat distribution and reduced radiant loading on plant surfaces, not heat disappearance. If you size cooling on the assumption that LEDs make no heat, you will build a room that drifts out of range.
Phytochrome A plant photoreceptor system that shifts between light-sensitive forms and helps measure night length, making it central to flowering control in photoperiod cannabis.
Another persistent error is treating photoperiod as the whole story. Cannabis flowering is triggered by uninterrupted dark-period perception through phytochrome signaling, so light leaks matter. But growth rate is not explained by hours alone. Daily photon delivery matters more.
Why wattage is a poor standalone metric
Wattage tells you what the utility meter sees. Plants care about photon flux density at the canopy.
That is why photosynthetic photon efficacy, measured in µmol/J, is a better fixture metric than watts. The DesignLights Consortium set a 2025 minimum efficacy threshold of 2.30 µmol/J for many horticultural luminaires on its qualified list. That is not a magic number, but it is a useful floor. If one fixture produces 2.3 µmol/J and another produces 3.1 µmol/J, the second delivers far more photons per unit of electricity. Over a flowering cycle, that difference lands directly on the power bill and the cooling load.
Wattage also ignores distribution. A fixture can have respectable efficacy and still perform badly if it concentrates too much intensity in the center and starves the edges. A flat, even canopy under a uniform map often outperforms a room with flashy peak numbers and weak side coverage. Average PPFD without a map can hide this problem.[1] Daily Light Integral: A Research Review and High-Resolution Maps of the United States. Erik S. Runkle. HortTechnology, 2015.
And wattage says nothing about time. A room at 600 µmol/m²/s for 18 hours receives the same DLI as a room at 900 µmol/m²/s for 12 hours: 38.9 mol/m²/day, using the Utah State formula. Same daily photon total, different morphology, room timing, and heat pattern. That single comparison exposes why “more watts in flower” is an oversimplification.
The framework that actually matters: PPFD, DLI, uniformity, heat, and cost
Start with PPFD: micromoles of photons hitting one square meter each second. That is the live intensity number at canopy level. Then calculate DLI:
DLI = PPFD × 3,600 × photoperiod hours ÷ 1,000,000
This is the metric Bugbee and Utah State repeatedly push because it connects intensity to time. For vegetative growth, roughly 300-600 µmol/m²/s for 18 hours gives about 19.4-38.9 mol/m²/day. For flowering at ambient CO2, many canopies perform well around 600-1,000 µmol/m²/s for 12 hours, or about 25.9-43.2 mol/m²/day. Push much beyond that without CO2 enrichment, irrigation precision, and temperature control, and returns shrink fast while stress risk climbs.
Uniformity comes next. A room averaging 850 µmol/m²/s with severe hot spots and dark corners is harder to manage than one averaging 750 with tight distribution. The leaves in the dim zones underperform; the leaves in the hot zone bleach or curl. Real canopy management happens in the spread between minimum and maximum PPFD, not just the average.[2] The carbon footprint of indoor Cannabis production. Evan Mills. Energy Policy, 2012.
Then heat. Lighting is a major energy load in indoor agriculture. Mills estimated in Energy Policy in 2012 that indoor cannabis cultivation accounted for about 1% of total U.S. electricity use at the time; the figure is dated, but it remains a marker of how energy-heavy this crop can be. The National Academies reported in 2023 that electric lighting can account for 20% to 50% of total energy use in indoor farms depending on design and climate. That is why efficacy is not trivia. It shapes operating conditions.
Finally, cost. Not just fixture cost. Photon cost. Cooling cost. Lamp replacement cost for HID. Dehumidification interactions. Electricity rate. A lighting choice that looks strong on paper can become inefficient once the HVAC bill is counted. That is why the right question is never “Which light type wins?” It is “How many usable photons reach the canopy per day, how evenly, and at what thermal and electrical price?”
Plant photobiology: how cannabis responds to light
Cannabis does not respond to “watts,” brand names, or internet folklore. It responds to photons, duration, temperature, and dark-period signaling. That sounds abstract until you reduce lighting to two linked jobs: first, supplying enough usable photons to drive photosynthesis; second, shaping plant form through photoreceptors that read spectral cues and day length. Those are different processes. Many guides blur them together and end up giving bad advice, especially the claim that red and blue are all that matter or that spectrum can compensate for weak intensity.
Bruce Bugbee at Utah State University has spent years pushing back on that kind of thinking. His basic point is simple: once nutrients, water, and temperature are not limiting, biomass tracks total photons delivered to the canopy over time far more reliably than it tracks spectral hype. That is why serious lighting discussion starts with PPFD and DLI, then asks how spectrum modifies that baseline.
PAR, ePAR, and the wavelengths cannabis actually uses
PAR, or photosynthetically active radiation, is the traditional 400-700 nanometer waveband used in horticulture. When a fixture’s output is reported as PPF or a canopy reading is reported as PPFD, those metrics usually count photons in that range. That framing is still useful. Most of the photons driving carbon fixation in cannabis are in PAR.
But PAR is not the whole story anymore. ePAR extends the accounting window to 750 nm, pulling far-red into the conversation because far-red photons can contribute to photosynthesis under some conditions, especially when combined with shorter wavelengths. This is not a theory invented by marketers. It reflects a shift in plant-light science, including work summarized in recent horticultural standards and extension teaching. Still, the practical lesson is not “load the room with far-red.” It is that the older 400-700 rule was a simplification, not a law of nature.
For indoor cannabis, PAR remains the main engine. If canopy PPFD is too low, no spectral tweak will rescue yield. That is why DLI is the better framing than a single instant reading. DLI equals PPFD multiplied by photoperiod seconds, divided by 1,000,000. A crop receiving 600 µmol/m²/s for 18 hours gets 38.9 mol/m²/day. A crop receiving 900 µmol/m²/s for 12 hours also gets 38.9 mol/m²/day. Same daily photon total, different schedule, different morphology, different flowering response. Utah State University uses examples like these to show why time matters just as much as intensity.
That distinction matters a lot in cannabis because vegetative and flowering stages use different photoperiods. A room can deliver a similar DLI in veg and flower while changing structure and development through day length. So when someone says a fixture is “strong enough” based only on wattage, they are skipping the real question: how many photons reach the canopy, how evenly, and for how long?
Photosystems, chlorophyll absorption, and why green light is not wasted
Photosynthesis begins when pigments absorb photons and transfer that energy to the reaction centers of photosystem II and photosystem I. In plain terms, light energy is captured, electrons are moved through a chain of carriers, ATP and NADPH are generated, and the Calvin cycle uses that chemical energy to fix carbon dioxide into sugars. Cannabis follows the same basic C3 photosynthetic machinery as many other broadleaf crops.
Chlorophyll a and chlorophyll b absorb strongly in blue and red regions, which is why those wavelengths became the stars of early grow-light diagrams. But those familiar absorption graphs are easy to misuse. A leaf is not a beaker of isolated pigment. It is a three-dimensional structure with multiple pigment systems, internal scattering, and different cell layers. What looks “less absorbed” at the pigment level can still be useful at the canopy level.
Green light is the classic victim of oversimplification. It is not wasted. Green photons penetrate deeper into leaves and deeper into dense canopies than red or blue photons alone. In upper leaf layers, blue and red are absorbed readily; green travels further before being absorbed or scattered, helping lower chloroplasts and shaded leaves keep working. That is one reason white LEDs, which include a broad spread of wavelengths with substantial green output, displaced the old blurple fixtures in serious horticulture. They are not popular because they look nicer to human eyes, though that helps with scouting. They are popular because broad-spectrum fixtures can support strong photosynthesis, better canopy penetration, and more balanced morphology without sacrificing fixture efficacy.
The idea that “plants only use red and blue” survives because it contains a grain of truth wrapped in a bad conclusion. Red and blue are highly active. They are not exclusive.

Photomorphogenesis: phytochrome, cryptochrome, and photoperiod signaling
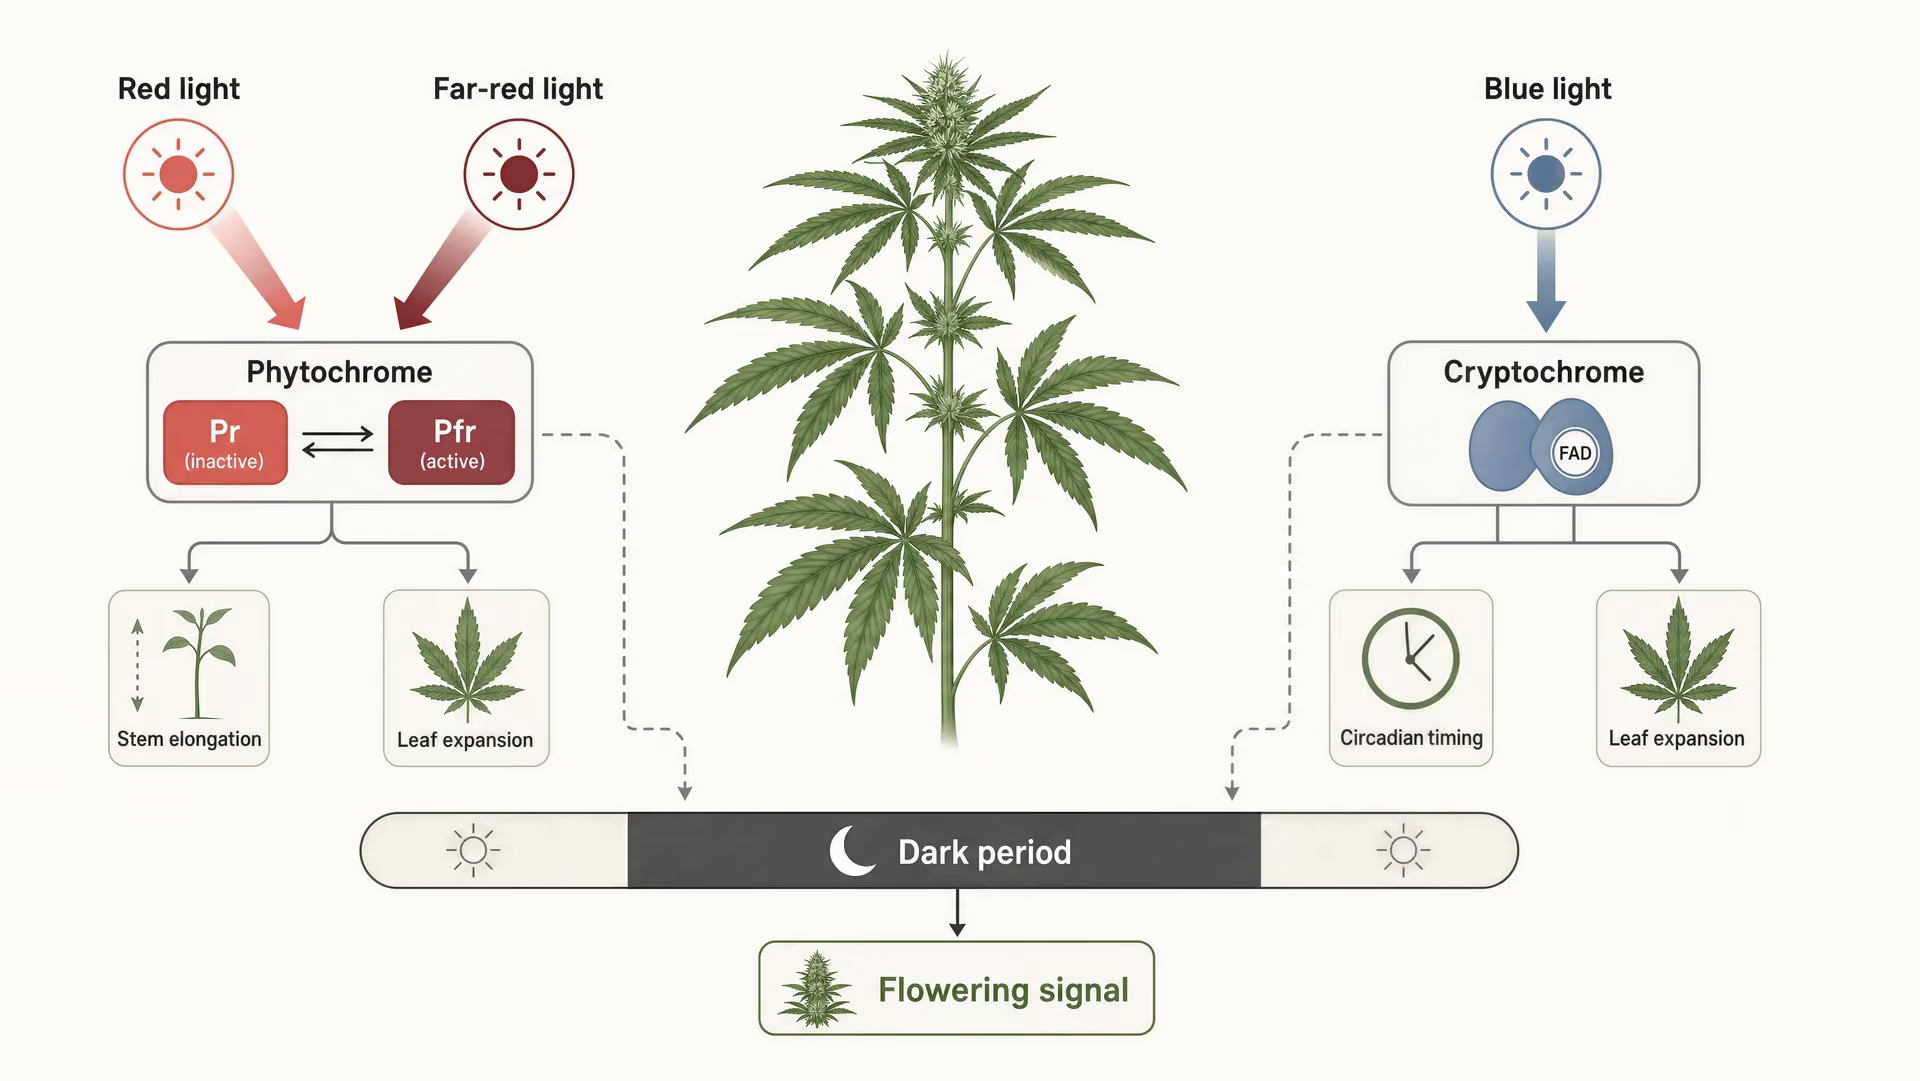
Not all photons are counted equally by the plant. Some drive photosynthesis directly. Others act as signals that alter shape, branching, leaf expansion, stem elongation, stomatal behavior, and flowering timing. This signaling layer is photomorphogenesis.
Phytochrome is central here. It exists in interconvertible forms that respond mainly to red and far-red light. In daylight, red-rich light converts phytochrome toward its active form. In darkness, that state slowly changes. The plant uses this chemistry to measure night length. Cannabis is a short-day plant in practical cultivation terms, which means flowering is triggered when nights are long enough and remain uninterrupted. The dark period matters more than many beginner guides suggest. A brief light interruption in the middle of the night can reset phytochrome signaling and confuse flowering. That is why light leaks are not a minor housekeeping issue in flower rooms.
Cryptochromes respond mainly to blue and UVA-adjacent wavelengths and help regulate circadian timing, leaf expansion, stem growth, and other developmental responses. They are one reason blue-rich spectra tend to produce stockier plants with shorter internodes. Yet blue should not be treated like a universal quality dial. Too little blue can encourage stretching; too much can suppress extension growth more than desired and sometimes reduce leaf expansion.
This is where spectrum and photoperiod intersect. A flowering schedule is not just “12 hours on, 12 hours off” because tradition says so. It works because uninterrupted darkness allows the plant’s photoperiod system to read a long night. The 12/12 convention is practical and reliable, but the underlying mechanism is phytochrome-mediated night-length perception, not a magical property of the number 12.
What blue, red, far-red, and UV do — and what growers overstate
Blue light, roughly 400-500 nm, tends to tighten plant architecture, support stomatal regulation, and influence leaf thickness and orientation. It is useful. It is also frequently overstated. Blue will not compensate for weak PPFD, poor uniformity, or a canopy cooked by excess heat.
Red light, roughly 600-700 nm, is highly efficient for photosynthesis and heavily involved in phytochrome signaling. It supports biomass accumulation well, which is why red-heavy fixtures can post strong efficacy numbers. But red alone often produces softer structure and more stem elongation than growers want. A crop under nearly monochromatic red can photosynthesize; it just may not develop in a desirable way.
Far-red, 700-750 nm, is the most abused part of the spectrum in cannabis marketing. Used carefully, it can alter shade-avoidance responses, increase leaf expansion, and in some cases improve canopy photosynthesis when paired with PAR. It can also push stretching if overdone. Far-red is a secondary tool, not a replacement for adequate PPFD in the 400-700 range. ePAR helps explain why far-red is not biologically irrelevant, but that should not be twisted into the claim that more far-red always means more yield.
UV reliably transforms cannabinoid or terpene output across all cannabis genotypes. Preliminary evidence
UV is even easier to exaggerate. UV-A and UV-B can induce protective responses, including increased flavonoid and other secondary metabolite production in some species and cultivars. But the dose window is narrow. Too little may do very little; too much damages tissue, depresses photosynthesis, and adds worker-safety issues. Claims that UV reliably transforms cannabinoid or terpene output across all cannabis genotypes are ahead of the evidence. There are cultivar-specific responses, but not enough consistency to treat UV as a primary production lever.
This is why broad-spectrum white LEDs became dominant. They cover the main photosynthetic waveband well, include green that helps canopy penetration, usually provide enough blue to control morphology, and can be supplemented with far-red or UV only when there is a clear reason. They also win on fixture efficacy. The DesignLights Consortium’s 2025 horticultural threshold is 2.30 µmol/J for many listed luminaires, while leading LED fixtures exceed 3.0 µmol/J. By comparison, traditional HPS often lands around 1.6-1.9 µmol/J according to DOE SSL materials and DLC-linked benchmarks. In a crop where lighting and cooling dominate operating energy, that gap is not trivial.
The photobiology point is straightforward. Cannabis needs enough daily photons to build biomass, and it uses spectral signals to decide how to grow and when to flower. Intensity first. Spectrum second. Darkness, when flowering is desired, is non-negotiable.

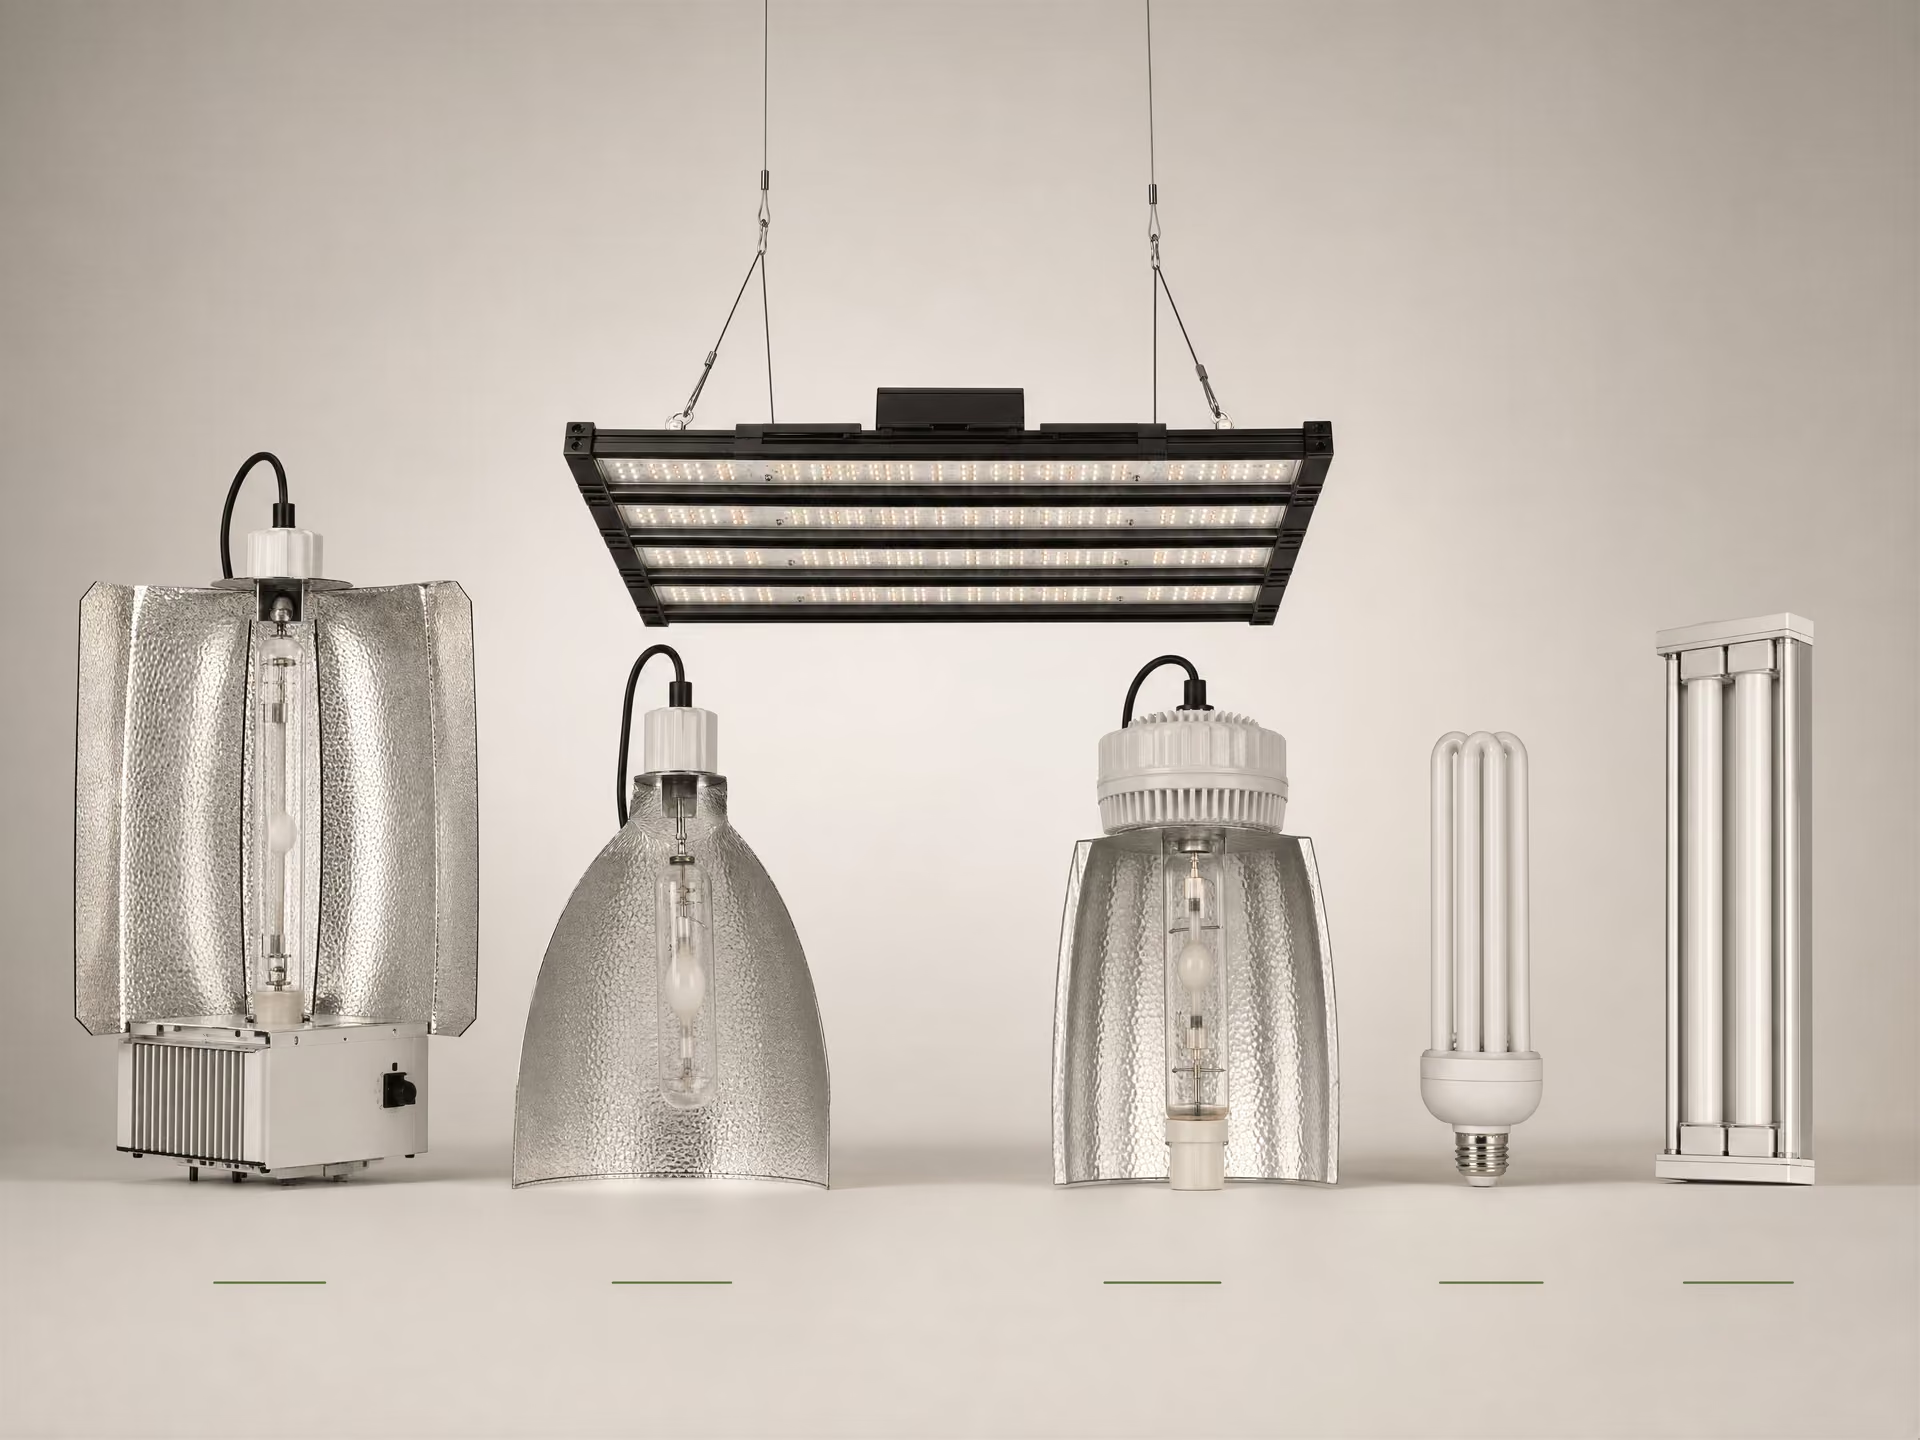
Grow light technologies compared: HPS, MH, LED, CMH/LEC, CFL, and fluorescent
The useful way to compare grow lights is not “which lamp is strongest” or “which spectrum is for veg.” It is how many photons reach the canopy, how evenly they are distributed, how much heat the system dumps into the room, how fast output declines with age, and what that does to electricity and cooling. Bruce Bugbee at Utah State has pushed this point for years: plants respond first to total photons delivered over time, not to marketing shorthand.
That is why fixture efficacy matters more than wattage alone. A 600 W fixture can be weak or strong depending on how efficiently it turns electrical energy into photosynthetic photons and how well it spreads those photons over the crop. It is also why lamp efficacy and fixture efficacy are not the same thing. A lamp may test well in isolation, but reflector losses, ballast losses, lens losses, and poor optical distribution lower the delivered performance of the full fixture.
High-pressure sodium: high output, high heat, aging efficiency
High-pressure sodium, or HPS, was the indoor flowering standard for a long time because it produced a lot of usable light at a scale that older fluorescent and HID alternatives could not match. Its spectrum is heavy in yellow, orange, and red wavelengths, with comparatively little blue. That spectral profile helped create the reputation of HPS as a “bloom light,” though the bigger reason for its success was simple: photon output per fixture was high enough to drive dense flowering canopies.
Traditional single-ended HPS systems were decent by the standards of their time. Double-ended HPS pushed efficiency and output higher. U.S. Department of Energy SSL materials and DLC-era benchmarking place common HPS fixture efficacy roughly around 1.0 to 1.7 µmol/J across generations, with good double-ended systems often around 1.6 to 1.9 µmol/J. That still trails modern LED fixtures by a wide margin.
HPS also ages badly compared with LED. The lamp does not just fail one day; it gradually loses photon output and spectral stability over time. That matters because a room can keep looking bright to human eyes while delivering materially fewer photons to leaves. Growers who never measure PPFD often miss this. In practice, HPS lamps usually need regular replacement to avoid yield erosion from depreciation. Exact intervals vary by lamp quality, operating temperature, ballast type, and tolerance for output loss, but HID systems are consumable-lighting systems. That is part of their cost structure whether people account for it or not.
Then there is heat. HPS throws significant radiant heat toward the canopy and significant convective heat into the room. Leaves under HPS often run warmer than leaves under LED at the same room air temperature. That can be helpful in cold spaces, but in sealed or warm rooms it raises cooling demand fast. The 2023 National Academies report on controlled environment agriculture noted that electric lighting can account for 20% to 50% of total energy use in indoor farms depending on crop and facility design. HPS tends to worsen the cooling side of that equation.
Metal halide: blue-rich legacy veg lighting and where it still appears
Metal halide, or MH, sits in the same HID family as HPS but with a bluer spectrum. That blue-heavy output made it a common vegetative-stage lamp in older cannabis rooms. The logic was reasonable: blue light tends to promote shorter internodes, more compact structure, and morphology that many growers prefer during vegetative growth. MH could produce healthier seedling and veg structure than HPS in side-by-side visual comparisons, especially when the alternative was a very warm HPS lamp.
The problem is economic, not botanical. MH is less efficient than modern LED fixtures and often less attractive even than HPS if total photons per watt are the metric. It also shares the HID weaknesses: bulb degradation, ballast losses, reflector dependence, and heavy heat output. For that reason, MH has largely been displaced in new installations.
Where does it still show up? Legacy rooms with existing ballasts and reflectors. Occasional dedicated mother or vegetative spaces. Some hybrid HID users still like MH for early stages before switching to HPS for flowering. But that pattern survives mostly because of installed infrastructure and user familiarity, not because MH is now the rational first choice for most indoor rooms.
Blue-rich light can be useful, yes. That does not mean MH is the best way to get it. Modern white LEDs already include substantial blue output, and spectrum can be adjusted with diode selection without accepting the efficiency and heat penalties of MH.
LED fixtures: efficacy, spectrum flexibility, and common design differences
Modern horticultural LEDs changed the discussion because they improved both fixture efficacy and fixture geometry. The best current systems are not just slightly better than HID. They are structurally different tools.
The DesignLights Consortium’s 2025 horticultural requirements set 2.30 µmol/J as a minimum efficacy threshold for many listed horticultural luminaires. Strong commercial LED fixtures often exceed 3.0 µmol/J. That gap matters. When a fixture delivers more photons per joule, it lowers both direct lighting energy per mole and usually the associated cooling burden.
LEDs also allow broad-spectrum white designs, red-heavy flowering designs, and mixed spectra that include deep red and sometimes far-red. This flexibility has generated a lot of bad advice. Spectrum matters, but it does not rescue inadequate intensity. Bugbee has repeatedly argued in extension lectures that growers often overspend on spectral claims while under-measuring actual photon delivery. He is right. A mediocre fixture with flashy red-blue marketing can lose to a good white fixture simply because the white fixture delivers more uniform, usable PPFD across the canopy.
There are major design differences within LED. Board fixtures, bar fixtures, and dense “quantum board” or panel-style layouts behave differently over a canopy. Multi-bar fixtures generally spread light more evenly across larger plant footprints and can be run closer with fewer hot spots. Dense central arrays can create higher peaks directly under the fixture and weaker edges unless spacing and dimming are carefully tuned. Michigan State and Purdue extension materials on greenhouse and indoor lighting have stressed this general principle for years: raise or spread the source and uniformity improves, though intensity at any one point falls.
LEDs also age, but not in the same way as HID bulbs. There is no routine bulb replacement cycle in most integrated LED fixtures. Instead, diodes slowly depreciate over many thousands of hours, while drivers are another possible failure point. Good fixtures usually maintain output far longer than HID lamps before replacement becomes a practical issue. The result is lower maintenance and more stable output over time.
One myth needs killing: LEDs do not “run cool.” They emit less radiant heat toward leaves than HPS, so canopy surfaces can stay cooler at the same air temperature. Purdue, Cornell CEA, and other controlled-environment sources have pointed this out. But nearly all input power still becomes heat in the room eventually. The difference is where and how that heat shows up. With LED, the room may feel easier to manage because there is less infrared load blasting the canopy, yet HVAC still has to remove the fixture’s electrical energy as heat.
CMH/LEC: spectral quality, UV claims, and practical trade-offs
Ceramic metal halide, often sold as CMH or LEC, earned a strong reputation because its spectrum is broader and more balanced than HPS. It includes more blue, a fuller visible profile, and some UV depending on lamp type and fixture glass. Many growers describe CMH-grown plants as having attractive morphology and strong secondary metabolite expression. That reputation is not pure fantasy. Broad-spectrum light can influence morphology, and UV can trigger stress-related responses in some species.
Still, CMH claims are often overstated. UV is not a stand-in for adequate PPFD, and small amounts of UV from a CMH lamp do not magically transform crop quality. The evidence from controlled-environment horticulture supports a more restrained view: photosynthetic photons from 400 to 700 nm do most of the heavy lifting for biomass, while far-red and UV are secondary tools that may shape morphology or chemistry under specific conditions. CMH can be a good broad-spectrum HID option. It is not a cheat code.
Efficiency is the practical limit. CMH generally lands between older MH systems and strong HPS systems, but below modern LED fixtures. It also carries HID-style drawbacks: lamp replacement, heat load, and fixture-level losses. In small rooms, some people still like CMH because one fixture can produce a pleasant broad spectrum and acceptable plant structure without the visual harshness of old red-blue LED arrays. But from a strict photons-per-joule and cooling standpoint, LED usually wins.
CFL and linear fluorescent lamps: propagation and low-intensity use cases
Compact fluorescent lamps and linear fluorescent tubes were once the entry point for small indoor gardens because they were cheap, easy to place, and less thermally aggressive at very close distances than HID. They still have uses. Seedlings, rooted clones, mother plants kept in slow vegetative growth, tissue culture support areas, and very small propagation shelves can all function well under fluorescent lighting.
That is where the endorsement should stop.
CFL and linear fluorescent systems are low-intensity tools by current standards. Their efficacy trails modern horticultural LED by a large margin, and their ability to deliver high, uniform PPFD over a flowering canopy is poor. They also degrade. Fluorescent lamps lose output as phosphors age and lamp chemistry shifts, even before obvious failure. Like HID, they require periodic replacement if stable photon delivery matters. Ballast issues and tube aging add maintenance overhead.
For serious flowering rooms, CFL and fluorescent are now niche at best. The reason is not fashion. It is that they struggle to deliver the PPFD and DLI that productive flowering canopies need without becoming inefficient, crowded, and awkward. If flowering targets at ambient CO2 are often around 600 to 1,000 µmol/m²/s for 12 hours, that equals roughly 25.9 to 43.2 mol/m²/day. Fluorescent systems are simply not a sensible way to reach those levels in most spaces.
What each technology does to canopy temperature, bulb replacement, and HVAC load
Canopy temperature is where these technologies feel different in practice. HPS and MH push more radiant heat directly onto leaves, often raising leaf temperature above ambient air temperature. That can increase transpiration and sometimes help in cool rooms, but it also increases bleaching and heat-stress risk when fixtures are too close. CMH behaves similarly, though usually with a somewhat different spectral and thermal profile depending on reflector and lamp.
LED shifts the balance. Leaf surfaces often run cooler under LED than under HPS at the same room dry-bulb temperature because there is less infrared radiation striking the canopy. That means setpoints often need adjustment. A room dialed in for HPS cannot always be copied directly to LED without changing air temperature, airflow, or VPD targets.
Replacement cycles separate the technologies even more sharply. HID and fluorescent systems are recurring-output-loss systems. Even before failure, they fade. HPS, MH, CMH, CFL, and linear fluorescent all need lamp changes on a real schedule if consistent PPFD matters. LED generally avoids routine lamp replacement and holds output longer, though drivers and diodes still age.
HVAC load follows the same pattern. Mills estimated in 2012 that indoor cannabis cultivation accounted for about 1% of all U.S. electricity use in the United States, a macro estimate with obvious limitations but still a useful warning about how energy-intensive indoor production can be. If lighting is a major electrical load and cooling is tied to lighting heat, fixture choice affects the whole room budget, not just the electric bill for the lamp itself.
So the comparison is plain. HPS remains capable of high-output flowering but runs hot and fades with age. MH is a blue-rich legacy veg tool now mostly kept alive by existing infrastructure. LED leads on fixture efficacy, controllability, and lower canopy heat burden, though not on “no heat.” CMH offers a pleasing broad spectrum and still appeals to some growers, but it does not escape HID economics. CFL and fluorescent remain serviceable for propagation and tiny low-light applications, not for modern high-yield flowering rooms. The smart comparison is photons, uniformity, degradation, and cooling load. Not wattage. Not folklore.
PPFD, DLI, and canopy uniformity: the metrics that decide yield
If you want a lighting setup that makes agronomic sense, stop asking how many watts a fixture pulls and start asking how many photons actually reach the canopy, how evenly they are distributed, and for how long. Bruce Bugbee at Utah State University has hammered this point for years: crop yield tracks total photon delivery far better than marketing claims about special colors or fixed hanging heights. That does not mean spectrum is irrelevant. It means spectrum does not rescue weak intensity, poor uniformity, or bad heat management.
Core lighting terms
- PPF
- Photosynthetic photon flux in µmol/s; the total photosynthetic photons a fixture emits each second.
- PPFD
- Photosynthetic photon flux density in µmol/m²/s; the photons landing on a square meter of canopy each second.
- PPE
- Photosynthetic photon efficacy in µmol/J; fixture efficiency, or photons produced per joule of electricity.
- DLI
- Daily light integral in mol/m²/day; the total photon dose delivered across the full photoperiod.
Four terms matter more than almost anything printed on a box:
- PPF: photosynthetic photon flux, measured in µmol/s**. This is the total number of photosynthetic photons a fixture emits each second.
- PPFD: photosynthetic photon flux density, measured in µmol/m²/s**. This is how many of those photons land on a square meter of canopy each second.
- PPE: photosynthetic photon efficacy, measured in µmol/J**. This is fixture efficiency: photons out per joule of electricity in.
- DLI: daily light integral, measured in mol/m²/day**. This is the total photon dose the plant receives across the whole photoperiod.
Those metrics connect plant biology to operating cost. They also expose why a lot of common advice is sloppy.
What PPFD measures and how to interpret a map
PPFD is an instant reading at canopy level. Not fixture output in free air. Not wall power. Not “equivalent watts.” A canopy can only photosynthesize with the photons that actually reach leaf surfaces, so PPFD is the number that matters in practice.
Manufacturers often publish a PPFD map: a grid of readings across a defined footprint at a stated hanging height. Read the conditions first. A map at 12 inches over a 3×3 area can look amazing and still be a poor choice for a 4×4 canopy. Likewise, a map that posts a very high center number may be less useful than one with a lower peak but tighter spread.
A few rules help interpret a map correctly:
Center intensity is not the whole story. If the middle reads 1,200 µmol/m²/s but corners are 350, the average may look acceptable while a large fraction of the canopy underperforms. That means uneven flower development, variable transpiration, and wasted electrical input.
Fixture geometry matters. Bar-style LED arrays usually spread photons more evenly than a compact point-source fixture hung too close. Michigan State University extension material associated with Erik Runkle and Roberto Lopez has repeatedly shown the tradeoff: increasing hanging height generally lowers peak intensity while improving uniformity. Too close creates hotspots and can drive bleaching or stress in the center before the edges get enough light.
PPFD maps are also only snapshots. Once plants fill in, leaf angle, canopy depth, and self-shading alter what lower leaves receive. A meter reading above the canopy is useful, but it is still a simplification.
One more distinction matters here. PAR traditionally refers to photosynthetically active radiation from 400 to 700 nm. Newer horticultural work sometimes uses ePAR, extending to 750 nm because far-red can contribute to photosynthesis under some conditions. That does not overturn the basic use of PPFD, but it does mean older “PAR-only” discussions can miss part of the picture. For most indoor cannabis rooms, though, the first-order question is still simple: are leaves getting enough total photosynthetic photons across the canopy?
How to calculate DLI step by step
PPFD tells you the photon rate. DLI tells you the daily photon dose.
The formula is:
DLI (mol/m²/day) = PPFD (µmol/m²/s) × 3,600 × photoperiod hours ÷ 1,000,000
How to calculate DLI
- 1 Start with PPFD in µmol/m²/s.
- 2 Multiply by 3,600 to convert seconds to hours.
- 3 Multiply by the number of light hours per day.
- 4 Divide by 1,000,000 to convert micromoles to moles.
The logic is straightforward: 1. Start with PPFD in µmol/m²/s. 2. Multiply by 3,600 to convert seconds to hours. 3. Multiply by the number of light hours per day. 4. Divide by 1,000,000 to convert micromoles to moles.
Example 1: vegetative room 500 µmol/m²/s for 18 hours
500 × 3,600 × 18 = 32,400,000 µmol/m²/day 32,400,000 ÷ 1,000,000 = 32.4 mol/m²/day
That matches Michigan State University extension examples from 2024.
Example 2: flowering room 800 µmol/m²/s for 12 hours
800 × 3,600 × 12 = 34,560,000 µmol/m²/day 34,560,000 ÷ 1,000,000 = 34.6 mol/m²/day
Again, a standard university extension calculation.
Here is the important insight many grow guides skip: the same DLI can be delivered through different combinations of intensity and photoperiod.
Utah State University’s controlled environment agriculture material gives a clean example:
- 600 µmol/m²/s for 18 hours = 38.9 mol/m²/day**
- 900 µmol/m²/s for 12 hours = 38.9 mol/m²/day**
Same daily photon dose. Very different crop environment.
Those two scenarios will not produce identical morphology. The 18-hour regime spreads photons over more time, often with lower peak stress and a different heat profile. The 12-hour regime concentrates photons into a shorter window, which is necessary in flower because short-day cannabis responds to uninterrupted darkness through phytochrome signaling. DLI is not the only variable. But if you do not know the DLI, you are guessing.
| Stage | PPFD range | Photoperiod used in article | DLI range |
|---|---|---|---|
| Seedlings and newly rooted clones | 100-300 µmol/m²/s | 18 hours | 6.5-19.4 mol/m²/day |
| Vegetative growth | 300-600 µmol/m²/s | 18 hours | 19.4-38.9 mol/m²/day |
| Flowering at ambient CO2 | 600-1,000 µmol/m²/s | 12 hours | 25.9-43.2 mol/m²/day |
Stage-specific target ranges for seedlings, vegetative growth, and flowering
Cannabis does not need flowering-room intensity from day one. Matching photon dose to plant stage reduces stress and makes dimming or fixture height adjustments rational rather than superstitious.
Seedlings and newly rooted clones: roughly 100-300 µmol/m²/s At 18 hours, that works out to about 6.5-19.4 mol/m²/day. Young plants have limited root systems and low demand. Push them too hard and you get stalled growth, curled leaves, and water balance problems before you get any benefit from extra light.
Vegetative growth: roughly 300-600 µmol/m²/s At 18 hours, that delivers about 19.4-38.9 mol/m²/day. This is a broad working range. Lower-vigor plants, recently transplanted plants, or rooms running warmer leaf temperatures may sit toward the lower half. Dense, healthy canopies under capable irrigation and nutrition can use the upper half.
Flowering at ambient CO2: roughly 600-1,000 µmol/m²/s At 12 hours, that gives about 25.9-43.2 mol/m²/day. Many indoor cannabis canopies perform very well in the 700-1,000 µmol/m²/s band when temperature, water, and nutrition are all in line. More is not automatically better. Without support from the rest of the system, high PPFD just increases stress risk and lowers margin for error.
These are targets, not commandments. Broad-spectrum white LEDs, HPS, and CMH can all be placed on the same framework if you measure canopy PPFD and calculate DLI. That is exactly why wattage-based comparisons mislead. A 650 W fixture with strong optics and good spread can outperform a higher-watt fixture that dumps photons into the center and starves the edges.
Why average PPFD can hide bad edge coverage
Average PPFD is useful, but by itself it can lie.
Imagine a nominal 4×4 canopy with these readings: 1,150 in the center, 950 in inner zones, and 450 in the corners. The average might still land in a respectable range, yet the room is not actually performing like a uniform 800 or 850 µmol/m²/s canopy. Some plants are near light saturation while others are underlit. The result is uneven development and lower whole-canopy efficiency.
Uniformity ratio A shorthand for how evenly PPFD is distributed across the canopy. The article uses min/avg PPFD and max/min to reveal dark edges and center hotspots that an average alone can hide.
This is where uniformity ratios help. A common shorthand is min/avg PPFD. If the minimum reading is 500 and the average is 800, the ratio is 0.625. Better uniformity means the minimum is closer to the average. Some growers also look at max/min to spot severe hotspots.
Why does this matter so much?
Because yield is collected from the whole canopy, not the brightest square foot. If edge plants receive too little light, the center does not compensate efficiently once it is already near its useful ceiling. The extra photons in the hotspot have diminishing returns. The weak corners drag down room output, quality consistency, and irrigation balance.
That is why fixture spacing and mounting height matter as much as fixture choice. Purdue and Michigan State extension resources both point to the same geometry problem: lower mounting height increases intensity but usually worsens spread. Raising fixtures and overlapping footprints often lowers the peak and improves the harvestable average. In many rooms, that is the better trade.
When CO2 enrichment changes the useful ceiling
At ambient CO2, there is usually a practical upper band where more PPFD gives smaller returns and can push plants into stress unless everything else is tuned tightly. For many cannabis rooms, that useful flowering zone sits around 700-1,000 µmol/m²/s.
CO2 enrichment changes that ceiling because photosynthesis becomes less carbon-limited. Under enriched conditions, some rooms run 1,200-1,500 µmol/m²/s in flower, which corresponds to roughly 51.8-64.8 mol/m²/day on a 12-hour schedule. But this is not a free gain from adding gas and turning the dimmer up.
What higher-PPFD CO2 rooms must support
- higher irrigation capacity
- tighter nutrient control
- leaf and air temperatures set for the faster metabolic rate
- vapor pressure deficit that supports transpiration without excessive stress
- strong uniformity, because hotspots become more punishing at elevated intensity
The room also needs: - higher irrigation capacity - tighter nutrient control - leaf and air temperatures set for the faster metabolic rate - vapor pressure deficit that supports transpiration without excessive stress - strong uniformity, because hotspots become more punishing at elevated intensity
Without those changes, enrichment just raises cost and narrows the safety margin. Bugbee has been blunt about this in educational talks: growers often chase spectral claims and ignore photon delivery and system limits. He is right. A canopy at 1,400 µmol/m²/s with poor irrigation and bad edge coverage is not advanced cultivation. It is expensive inconsistency.
This is also where economics returns to the discussion. The National Academies reported in 2023 that electric lighting can account for 20% to 50% of total energy use in indoor farming systems, and Mills estimated in Energy Policy in 2012 that indoor cannabis production accounted for about 1% of total U.S. electricity use at the time. So fixture efficacy is not a side note. DLC’s 2025 horticultural threshold of 2.30 µmol/J gives a current floor for serious efficiency, while many modern LED fixtures exceed 3.0 µmol/J. Older HPS systems often sit around 1.6-1.9 µmol/J. More photons per joule means a lower cost per unit of DLI delivered. That is the calculation that matters.
Light cycles for cannabis: vegetative growth, flowering, and the dark period
Cannabis light schedules make sense only when you look at two things together: photoperiod signaling and total daily photons. The old habit of treating 18/6 and 12/12 as sacred recipes misses the mechanism. Plants do not count watts. They perceive night length through phytochrome, and they accumulate usable light as daily light integral, or DLI.
The math is simple: DLI (mol/m²/day) = PPFD (µmol/m²/s) × 3,600 × hours of light ÷ 1,000,000
That formula explains why schedule alone tells you very little. A canopy at 600 µmol/m²/s for 18 hours gets 38.9 mol/m²/day. A canopy at 900 µmol/m²/s for 12 hours also gets 38.9 mol/m²/day. Same daily photon total, different day length, different flowering response, different heat timing.
Why 18/6 became standard in vegetative growth
Eighteen hours on and six hours off became the default for vegetative growth because it is a practical compromise, not because the plant contains an internal preference for “18.” In photoperiod cannabis, long days suppress flowering and keep the plant in vegetative development. Once day length is long enough to prevent floral induction, the remaining question is economic and physiological: how many photons can the canopy use without causing unnecessary heat, electricity use, or stress?
That is where DLI matters more than tradition. Under 18/6, a moderate vegetative PPFD of 300 to 600 µmol/m²/s delivers about 19.4 to 38.9 mol/m²/day. That range is often enough to build a dense canopy, maintain compact morphology, and avoid the wasted power that comes with very long photoperiods at the same intensity. Bruce Bugbee at Utah State University has repeatedly argued in extension lectures that growers obsess over spectrum while failing to measure photon delivery. This is one of those cases. If vegetative plants are getting enough DLI and staying out of flower, 18/6 works because it balances growth and operating cost.
The six-hour dark period can also help with room management. Respiration, irrigation timing, leaf temperature, and HVAC loads all change across the light cycle. LEDs do not erase this. They reduce radiant heating of leaves compared with HID, but fixture input power still ends up as room heat. Given that lighting can account for 20% to 50% of energy use in indoor farms, according to the 2023 National Academies report on controlled environment agriculture, shaving unnecessary lighting hours matters.
Could 16/8 or 20/4 also work in veg? Yes. The point is not that 18/6 is biologically magical. It became standard because it keeps photoperiod cultivars vegetative while landing in a useful DLI window without running the room around the clock.
12/12 flowering and phytochrome-mediated dark-period control
Flowering in photoperiod cannabis is controlled primarily by uninterrupted darkness, not by the plant “needing” exactly twelve hours of light. Cannabis is a short-day, or more precisely long-night, plant. The trigger is night length perceived through the phytochrome system, which shifts between forms in light and darkness. When the dark period is long enough, downstream flowering signals are allowed to proceed.
That is why 12/12 became the industry standard. It is a reliable schedule that gives a long enough night to induce and maintain flowering in most photoperiod cultivars while still providing enough daytime for productive photosynthesis. It is a safe operational compromise.
What many guides miss is that 12/12 cuts DLI unless PPFD rises. A veg canopy at 500 µmol/m²/s for 18 hours receives 32.4 mol/m²/day. Move that same canopy to 12 hours without increasing intensity and DLI drops to 21.6 mol/m²/day. If the fixture is strong enough, flowering rooms often compensate by running around 700 to 1,000 µmol/m²/s at ambient CO2, yielding about 30.2 to 43.2 mol/m²/day over 12 hours. That is why flowering under a short photoperiod often requires higher instantaneous intensity than veg.
Dark interruptions matter because they alter phytochrome state. Even brief light leaks during the night period can delay flowering, cause re-vegetative tendencies, or produce inconsistent floral development. The effect depends on intensity, spectrum, timing, and cultivar sensitivity, but the principle is settled horticultural science: if the plant detects enough light during the dark period, the night may no longer register as “long.” This is why casual advice that “a little light leak is fine” is reckless. In photoperiod cultivars, the dark period is not decorative. It is the signal.
| Schedule | Example PPFD in article | Resulting DLI | Main tradeoff described |
|---|---|---|---|
| 18/6 | 500 µmol/m²/s | 32.4 mol/m²/day | Baseline vegetative standard |
| 20/4 | 500 µmol/m²/s | 36.0 mol/m²/day | Higher electricity use and more cumulative heat |
| 24/0 | Not quantified in article | Higher than 20/4 at the same PPFD | Continuous heat and cost may not improve efficiency |
| 12/12 flower | 700-1,000 µmol/m²/s | 30.2-43.2 mol/m²/day | Requires uninterrupted dark period |
Alternative schedules: 20/4, 24/0, gas lantern, and why most are niche
Alternative schedules usually promise faster growth, lower energy use, or better control. Most deliver tradeoffs rather than advantages.
20/4 is the simplest alternative to 18/6. It increases DLI at the same PPFD. For example, 500 µmol/m²/s for 20 hours gives 36.0 mol/m²/day, versus 32.4 at 18 hours. If temperature, root-zone oxygen, irrigation, and genetics are all in line, that can increase vegetative growth. The cost is four things: more electricity, more cumulative fixture heat, less dark recovery time, and sometimes little visible gain if the canopy was already near its useful daily photon limit.
24/0 pushes this further. It can keep photoperiod plants vegetative, and some growers report acceptable performance. But the plant does not gain bonus points for never seeing darkness. Continuous lighting can raise DLI, yet that does not mean it is automatically efficient. If you can hit the same or better growth targets with 18/6 at a slightly higher PPFD, 24/0 often becomes an expensive way to make heat. In rooms where lights are a dominant load, this matters. Mills' 2012 Energy Policy estimate that indoor cannabis accounted for about 1% of U.S. electricity use was controversial in scope and is dated, but it still underlines how costly bad lighting habits can become at scale.
The gas lantern routine is more fragile than its advocates admit. A common version uses 12 hours on, 5.5 off, 1 on, 5.5 off during veg, with the one-hour night interruption intended to prevent flowering while reducing energy use. The problem is obvious if you understand photoperiodism: this schedule depends on manipulating night signaling with precision. Cultivar variation, timer errors, stray light, and stress can make responses inconsistent. It can work. It is also a niche technique that asks for more complexity in exchange for relatively small savings.
Auto-flowering plants and why the rules differ
Auto-flowering cannabis does not follow the same rules because floral transition is driven much more by age and genetics than by long, uninterrupted nights. The trait comes largely from Cannabis ruderalis ancestry. Autos still use light for photosynthesis, so schedule still changes DLI, growth rate, and heat load. What changes is the flowering trigger.
That is why autos are often grown under 18/6, 20/4, or even 24/0 from start to finish. Since they do not need 12 hours of darkness to flower, the main calculation becomes photon economics. More light hours at the same PPFD mean more DLI. But the same caution applies: more DLI is helpful only while the plant can use it. Once CO2, temperature, water supply, and root health become limiting, extra hours become extra cost.
So the rule set is different, not absent. Photoperiod plants demand darkness discipline because phytochrome controls flowering. Autos mostly turn that question into one of total photons, environmental capacity, and efficiency.
Light height, dimming, and intensity management across the crop cycle
Light setup is not a one-time choice. It is a moving target shaped by plant age, canopy shape, room temperature, fixture geometry, and the daily light integral you are trying to deliver. That is why fixed charts like “hang LED 18 inches above canopy” mislead so many growers. A height number without PPFD, uniformity, and heat context is just a guess.
Bruce Bugbee at Utah State has hammered this point for years: the plant responds to photons delivered over time, not to brand mythology and not to wattage labels. The practical translation is simple. Measure or estimate canopy PPFD, convert it to DLI using the actual photoperiod, and then adjust height and dimming together. DLI = PPFD × 3,600 × hours ÷ 1,000,000. So 500 µmol/m²/s for 18 hours gives 32.4 mol/m²/day, while 800 µmol/m²/s for 12 hours gives 34.6 mol/m²/day. Similar daily photon totals, different crop behavior.
Fixture type changes how height behaves. A point-source lamp such as HPS or an LED fixture with tight optics throws a steep intensity gradient. Raise it a little and center PPFD drops fast, while edge uniformity improves. Bar-style LEDs spread diodes across a larger area, so they can sit closer to the canopy with less severe hot spotting. Purdue, Michigan State, and Cornell controlled-environment resources all make the same basic point: distance affects both intensity and uniformity, and those are not the same problem.
Seedlings and clones: avoiding stretch without bleaching
Young plants need enough light to suppress weak, elongated growth, but they are easy to stress because roots, cuticle development, and water uptake are still immature. This is where beginners often make two opposite mistakes. One group hangs the fixture too high and gets pale, stretched transplants. The other group sees a seedling chart online, ignores fixture power and optics, and bleaches tender tops.
A workable target is often around 100-300 µmol/m²/s, depending on propagation method, humidity, and cultivar sensitivity. Clones with fresh callus and unrooted cuttings belong at the low end. Hardened seedlings with active root growth can move upward. If the photoperiod is 18 hours, that range gives roughly 6.5-19.4 mol/m²/day. Not much by flowering standards, but enough to build compact early structure without forcing stress.
Height alone is a sloppy control method here. Dimming is better if the fixture allows it. With a bar LED, you can keep the fixture relatively close for good uniformity, then dim to the target PPFD. With a strong point-source fixture, raising the lamp may be necessary, but expect more edge-to-center variation. That matters in a tray of clones: some plants bleach while others stretch, all under the same lamp.
Watch leaf temperature as much as air temperature. LEDs emit less radiant heat toward leaves than HID, a point discussed in Purdue and Cornell CEA materials, but “less radiant heat” does not mean “no heat.” If the room is cool and the LED is efficient, leaves can run cooler than expected, slowing metabolism even when PPFD looks acceptable. If the fixture is too close, localized heat from the driver or lens pattern can still damage the top layer.
Vegetative canopy build-out: matching intensity to plant size
As the canopy expands, the goal changes from survival to architecture. You are trying to build enough leaf area, branch strength, and node density to support flowering later. Most healthy vegetative canopies do well somewhere around 300-600 µmol/m²/s on an 18-hour schedule, equal to about 19.4-38.9 mol/m²/day. The wide range matters because a small, newly transplanted plant is not the same as a trained, rooted, fast-growing one.
This is where fixture geometry and training style start to matter. A flat, topped canopy under a bar fixture can take a closer, more uniform light field. A tall, Christmas-tree architecture under the same fixture often develops uneven exposure because top shoots intercept photons while lower sites sink into shade. You can solve that by raising the fixture, dimming less, and accepting slightly lower peak PPFD in exchange for better canopy-level consistency.
Do not chase maximum center readings. Chase useful distribution. Erik Runkle and Roberto Lopez have both emphasized in extension work that increasing hanging distance often lowers the center hotspot and improves average uniformity across the crop. For cannabis, that often means less pruning panic later and fewer underlit corners.
Vegetative rooms also reveal the economic side of intensity management. Lighting is one of the largest energy loads in indoor cultivation; Mills estimated indoor cannabis accounted for about 1% of all U.S. electricity use in 2012, and the 2023 National Academies report on controlled environment agriculture states electric lighting can make up 20%-50% of total indoor farm energy use. Running more intensity than the crop can use is not only agronomically wasteful. It is expensive, and it adds heat your HVAC system must remove.
Flowering: increasing PPFD without creating hot spots
Flowering is where many growers overreact. They switch to 12/12, turn the fixture to full power, and hang it at whatever number the manufacturer printed. That approach often overshoots canopy capacity in the center while leaving the edges mediocre.
At ambient CO2, many flowering rooms perform well around 700-1,000 µmol/m²/s if irrigation, nutrition, and temperature are in line. On a 12-hour photoperiod, that is roughly 30.2-43.2 mol/m²/day. Push much above that without CO2 enrichment and diminishing returns arrive fast. Bugbee has repeatedly argued that more photons help until some other factor becomes limiting; after that, extra PPFD mostly raises stress risk and power cost.
The ramp into flowering should usually be gradual. Increase intensity as the canopy finishes stretch and fills its footprint. Early flower often benefits from a bit of restraint because plant spacing and canopy depth are still changing. Once the structure stabilizes, raise PPFD in steps while checking multiple canopy points, not just one center measurement. A quantum sensor is ideal. A well-calibrated phone-based estimator is weaker but still better than a hanging-height superstition.
Hot spots are the real enemy. With point-source HID or tightly focused LED fixtures, center tops can receive far more light than the room average suggests. That is one reason double-ended HPS rooms often had a narrow window between productive intensity and heat stress. Modern bar LEDs reduce that problem, but they do not erase it. If the upper leaves nearest the fixture are taking 1,100 µmol/m²/s while the corners sit at 650, the average may look acceptable while plant responses become uneven.
Reading plant signals: tacoing, bleaching, foxtailing, and excess internode stretch
Plants do report lighting errors, but the signals are messy because heat, VPD, irrigation, and genetics overlap.
Tacoing or upward leaf cupping usually means excessive stress load at the leaf surface. That may be too much PPFD, too much leaf temperature, or both. Under LEDs, people often miss the temperature part because the room does not feel hot. Measure leaf temperature if possible. A cool room with intense light can still produce stress if transpiration and root uptake cannot keep pace.
Bleaching is more direct. Tops lose chlorophyll, often first on the highest flowers or the youngest leaves nearest the fixture. That is a classic sign that local intensity is too high for that tissue. Spectrum can influence the appearance, but the fix is usually lower PPFD at the top, better fixture spread, or canopy leveling.
Foxtailing is trickier. Some cultivars naturally stack that way late in flower. Stress foxtailing, though, often appears alongside excessive top intensity or heat. If only the nearest tops are doing it while lower flowers look normal, suspect fixture placement before blaming genetics.
Excess internode stretch points the other direction: insufficient PPFD at the canopy, poor blue fraction in some older fixtures, too much far-red influence at the wrong time, or simple over-distance from the light. In practice, weak canopy PPFD is the usual cause. Spectrum does not rescue low photon delivery.
Why fixed hanging-height charts are only rough starting points
Height charts survive because they are easy to print, not because they are precise. They rarely tell you beam angle, map uniformity, drive current, room reflectivity, cultivar height, trellis use, or whether the dimmer is set to 40% or 100%. Those missing variables are the entire problem.
Inverse-square behavior explains part of the confusion. With a true point source, intensity falls rapidly with distance. Double the distance and intensity drops to roughly one-quarter. But many LED fixtures are not point sources. A multi-bar fixture with many diodes spread over a large footprint does not follow a simple point-source rule at canopy scale. That is why one 18-inch recommendation can be sensible for one fixture and awful for another.
Use charts as a safe first setup, then manage from measurements and plant response. Start conservative. Check PPFD at the center, edges, and corners. Adjust height for spread, dimming for target intensity. Recheck after training, after stretch, and after any major defoliation because canopy reflectance and depth change. The “right” fixture height is not fixed even within one run. It moves with the crop.
Heat management, airflow, and leaf temperature under different fixtures
Bad lighting advice usually fails at thermodynamics before it fails at horticulture. A fixture does not just deliver photons. It also dumps heat into a space, changes leaf temperature, shifts transpiration, alters dehumidification demand, and determines how hard the HVAC system has to work. If you ignore that chain, you can hit the “right” PPFD and still end up with weak gas exchange, stressed leaves, wet rooms, or runaway power costs.
The phrase “LEDs run cool” is the classic example. Leaves under LEDs often do feel cooler than leaves under HPS. That part is real. The conclusion people draw from it is not. Cooler leaves do not mean the room is not receiving heat. Nearly every watt entering a grow room ends up as heat sooner or later.

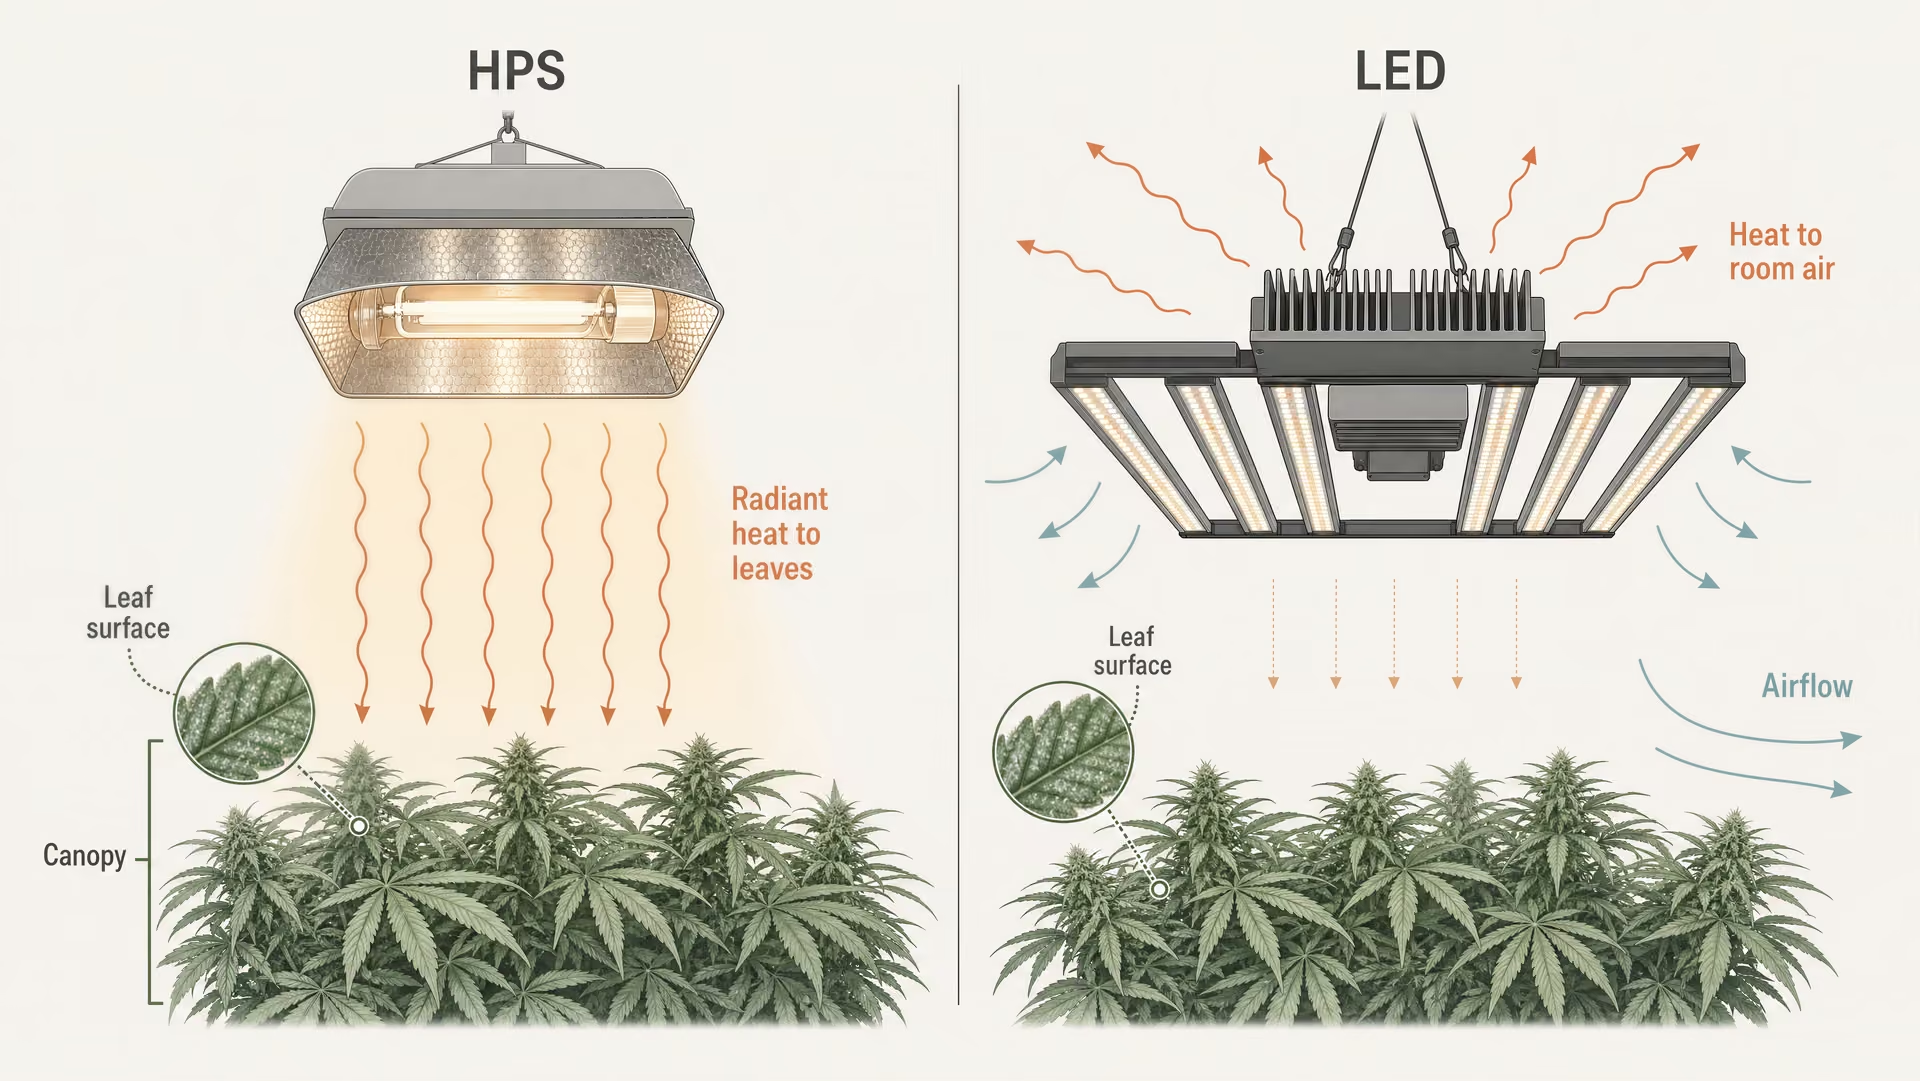
Radiant heat versus ambient room heat
Plants do not experience all heat in the same way. A leaf can be warmed directly by radiation from a lamp, or indirectly by warm air moving across its surface. HID fixtures, especially HPS, send a larger fraction of their energy as radiant heat toward the canopy, including near-infrared. That is why leaves under HPS often run warmer than room air. An LED fixture, particularly a white bar-style fixture, usually sends less infrared toward the leaves, so leaf surface temperature is often lower at the same dry-bulb air temperature.
That distinction matters because plant responses are happening at the leaf, not at the thermostat on the wall. Cornell CEA, Purdue, and Michigan State extension materials all emphasize that fixture type changes leaf-air relationships. Under HPS, a room at 78°F can produce a warmer leaf than the same room under LEDs. Under LEDs, the leaf may sit at or even a bit below air temperature if airflow is strong and transpiration is active.
This is why fixed air-temperature advice is weak advice. A canopy under HPS and a canopy under LED can need different room setpoints to land in the same physiological zone.
Radiant load also changes the shape of the stress. Too much radiant energy can create localized leaf overheating and floral surface heating even when ambient room temperature looks acceptable. Ambient heat, by contrast, tends to be more uniform but raises the whole room’s cooling burden. One burns from above. The other fills the box.
Why LEDs still heat the room even when leaves feel cooler
The energy balance is simple. If a fixture draws 600 watts from the wall, almost all of that 600 watts becomes heat in the room eventually, except for the tiny fraction exported as stored chemical energy in plant biomass. Some heat leaves the room with exhaust air or is removed by air conditioning, but the room still has to deal with it.
So why do LEDs feel cooler at canopy level? Because they usually change where and how the heat is delivered. Less is radiated directly onto leaves. More is dissipated at the heat sink and then mixed into room air. The result is lower leaf temperature but not zero heat load.
That is a major planning issue. A grower switching from double-ended HPS to high-efficacy LED often sees two things at once: lower leaf temperature and lower total HVAC burden per photon delivered. Those are related, but they are not the same. Modern LED fixtures commonly exceed 3.0 µmol/J, while traditional double-ended HPS often lands around 1.6 to 1.9 µmol/J, according to DOE SSL materials and DLC-linked benchmarks. That means LEDs can produce the same canopy PPFD with less input power. Less input power means less total heat generated for the same photon output. But “less heat” is not “no heat.”
This is where economics and plant biology finally meet. The National Academies reported in 2023 that electric lighting can account for 20% to 50% of total energy use in indoor farming systems, depending on crop, climate, and design. Mills’ 2012 Energy Policy estimate that indoor cannabis used about 1% of all U.S. electricity is dated, but it still captures the scale of the issue. Lighting choices do not just alter crop response. They rewrite the cooling bill.
The practical consequence under LEDs is often a warmer target air temperature than people expect. Because leaves run cooler, many rooms need a higher dry-bulb setpoint to maintain similar leaf temperature, transpiration, and metabolic pace. Running an LED room at old HPS air temperatures can leave leaves too cool, especially if airflow is aggressive and humidity is high.
Managing HID heat with extraction, air-cooled hoods, and room design
HID rooms are less forgiving because they stack high radiant load on top of high electrical load. You are not only cooling the room. You are protecting the canopy from direct thermal stress.
Extraction helps by removing hot air before it recirculates through the crop. Air-cooled hoods can reduce how much lamp heat reaches the room and canopy, though they are not free in performance terms. Depending on the hood design, glass cleanliness, duct layout, and fan pressure losses, you may trade away some photon delivery and uniformity to gain thermal control. Sometimes that is the right trade. In a hot climate or a weak room, it often is.
Room design matters more with HID than many guides admit. Short ceilings, poor return-air placement, and dead air above the canopy all amplify radiant stress. If hot air pools near the fixture and the only strong airflow is blasting sideways across leaves, the crop gets both overheated and mechanically stressed. Better designs move heat up and out while maintaining gentle, consistent canopy movement. You want mixing, not punishment.
Fixture spacing matters too. Michigan State work on greenhouse and indoor lighting geometry has long shown that more distance can improve uniformity even as peak intensity drops. With HID, that extra distance can also reduce canopy hot spots. The common beginner move of hanging HPS as close as hand comfort allows is a good way to create uneven PPFD, bleached tops, and overheated leaves.
VPD, transpiration, and the lighting-climate connection
Lighting sets the demand signal. Climate determines whether the plant can answer it.
VPD Vapor pressure deficit. A climate metric combining temperature and humidity that indicates how strongly air draws water from leaves, shaping transpiration and plant cooling.
When PPFD rises, stomata tend to open, photosynthesis accelerates, and the plant tries to move more water from root to leaf to support carbon gain and cooling. That is transpiration. Vapor pressure deficit, or VPD, describes how strongly the air pulls water from the leaf. It depends on air temperature, leaf temperature, and humidity. Change the fixture, and you often change all three.
Under HPS, leaves usually run warmer, so leaf-to-air vapor pressure relationships shift upward. That can raise transpiration pressure even if room RH is unchanged. Under LED, cooler leaves can reduce leaf vapor pressure and lower transpiration at the same room conditions. This is one reason LED rooms often need different humidity and temperature targets than HPS rooms. Copying an HPS climate recipe into an LED room can produce sluggish water movement, softer growth, weaker calcium transport, and higher disease risk in dense canopies.
Bruce Bugbee has spent years arguing that growers fixate on spectrum claims while under-measuring photon delivery and environmental control. He is right on this point too: if you increase light, you must be ready to increase environmental support. More photons without the right temperature, humidity, irrigation timing, and root-zone oxygen do not automatically mean more yield. At ambient CO2, many flowering canopies perform well around roughly 700 to 1,000 µmol/m²/s. Push past that without matching climate and water management, and the response curve flattens while stress risk rises.
DLI shows the same principle over time. Utah State’s examples make it plain: 600 µmol/m²/s for 18 hours gives 38.9 mol/m²/day, and 900 µmol/m²/s for 12 hours also gives 38.9 mol/m²/day. Same daily photons. Not the same thermal profile, not the same transpiration pattern, and not the same room management.
That is the real lighting-climate connection. The lamp is not just a light source. It is a heat source, a dehumidification driver, and a leaf-temperature controller. Treat it that way, and fixture comparisons start making sense. Ignore it, and even a strong lighting plan can fail at the canopy.
Energy efficiency and cost comparison over a full grow cycle
Indoor cultivation economics are dominated by one fact many lighting guides dodge: you are not paying for watts in the abstract, and you are not paying for a spectrum chart. You are paying to deliver usable photons to a square meter of canopy for a set number of hours, while also paying to remove the heat those watts become. Once you frame lighting that way, a lot of familiar advice collapses. A “cheap” fixture can be expensive over a year. A higher-efficiency fixture can be the lower-cost choice even when its upfront price is materially higher.
Mills estimated in Energy Policy (2012) that indoor cannabis cultivation accounted for about 1% of total U.S. electricity use at the time. That figure is old and should not be read as a current market snapshot, but it still captures the scale of the energy problem. The 2023 National Academies report on controlled environment agriculture makes the same point in more current terms: electric lighting can account for 20% to 50% of total energy use in indoor farms, depending on crop, building design, and climate. Lighting is not a side cost. It is one of the main costs.
Fixture efficacy: µmol/J versus wall watts
Wall watts tell you power draw. They do not tell you how many photosynthetic photons reach the canopy. For that, fixture efficacy matters more. The metric is photosynthetic photon efficacy, measured in micromoles per joule (µmol/J). It answers a simple question: how many photons in the photosynthetically useful range does the fixture emit for each joule of electricity consumed?
That is why the DesignLights Consortium uses efficacy thresholds in its horticultural technical requirements. In 2025, DLC set a minimum efficacy requirement of 2.30 µmol/J for many horticultural luminaires. Many current commercial LEDs clear 3.0 µmol/J. By contrast, the U.S. Department of Energy SSL program and DLC-backed market data place traditional double-ended HPS fixtures broadly around 1.6 to 1.9 µmol/J, with older HID systems often lower.
This gap matters more than the badge wattage on the fixture. Suppose you need about 900 µmol/m²/s over a square meter in flower. A 3.0 µmol/J LED needs roughly 300 watts at the fixture to emit 900 µmol/s before room-level losses and layout effects. A 1.8 µmol/J HPS needs roughly 500 watts to emit the same photon flux. Same photon target, very different power draw. If the canopy gets the same PPFD and uniformity is acceptable, the plant does not care that one fixture used more electricity to do the job. Your meter does.
After basic spectrum quality is met, fixture efficacy and canopy distribution usually matter more than spectral fine-tuning for cost and delivered photon performance. Strong evidence
Bruce Bugbee at Utah State has been blunt in extension lectures on this point: growers often overpay for spectral claims and under-measure photon delivery. He is right. Spectrum matters, but after basic spectrum quality is met, efficacy and canopy distribution usually decide the electric bill.
Electricity cost per cycle and per square meter
You can estimate lighting cost with high-school arithmetic. Start with fixture power in kilowatts, multiply by daily hours, then by the number of days in each stage.
kWh per stage = fixture kW × photoperiod hours × days
Then:
lighting cost = total kWh × electricity rate
| Metric | 650 W LED | 1,000 W HPS |
|---|---|---|
| Vegetative energy use (28 days at 18 h) | 327.6 kWh | 504 kWh |
| Flowering energy use (56 days at 12 h) | 436.8 kWh | 672 kWh |
| Total cycle energy use | 764.4 kWh | 1,176 kWh |
| Lighting cost at $0.12/kWh | $91.73 | $141.12 |
| Lighting cost at $0.25/kWh | $191.10 | $294.00 |
A simple example makes the difference clear. Compare one 650 W LED fixture with one 1,000 W HPS fixture covering similar canopy area over a full cycle:
- Vegetative stage: 28 days at 18 hours/day
- Flowering stage: 56 days at 12 hours/day
LED energy use: - Veg: 0.65 × 18 × 28 = 327.6 kWh - Flower: 0.65 × 12 × 56 = 436.8 kWh - Total: 764.4 kWh
HPS energy use: - Veg: 1.0 × 18 × 28 = 504 kWh - Flower: 1.0 × 12 × 56 = 672 kWh - Total: 1,176 kWh
At $0.12/kWh: - LED lighting cost: $91.73 - HPS lighting cost: $141.12
At $0.25/kWh: - LED lighting cost: $191.10 - HPS lighting cost: $294.00
That is per fixture, per cycle, before cooling. In regions with expensive electricity, the difference becomes large fast.
To compare by area, divide by the square meters actually lit to target PPFD. If both fixtures effectively cover 1.2 m² in flower, then at $0.25/kWh:
- LED: $191.10 ÷ 1.2 = $159.25 per m² per cycle
- HPS: $294.00 ÷ 1.2 = $245.00 per m² per cycle
This is the right way to think about it. Not fixture versus fixture in a vacuum, but cost per square meter at the required DLI and uniformity.
DLI helps keep the math honest. Utah State’s CEA resources show that 600 µmol/m²/s for 18 hours gives 38.9 mol/m²/day, and 900 µmol/m²/s for 12 hours also gives 38.9 mol/m²/day. Same daily photons, different schedule. Michigan State extension gives another pair: 500 µmol/m²/s for 18 hours equals 32.4 mol/m²/day, while 800 µmol/m²/s for 12 hours equals 34.6 mol/m²/day. If one fixture reaches target DLI with less electricity, it has an operating advantage even before HVAC is counted.
Bulb replacement, driver life, and maintenance costs
Opex is not just electricity. HID systems carry recurring lamp costs and more frequent maintenance. HPS and MH lamps degrade over time; usable photon output falls long before the fixture stops turning on. That means either accepting lower PPFD as the cycle count rises or replacing bulbs on a schedule. Ignitors, reflectors, and ballasts also age.
LEDs usually avoid annual bulb replacement, but they are not maintenance-free. Drivers fail. Diodes depreciate. Fans, if present, add a failure point. The difference is that a quality LED typically spreads maintenance cost over a longer service life. A common rated life claim is L90 or L70 over tens of thousands of hours, though those figures must be treated carefully because they describe lumen or photon maintenance under test conditions, not guaranteed field life.
The practical cost distinction is simple. HID asks for lower capex and higher recurring parts cost. LED asks for higher capex and usually lower recurring parts cost. If you run multiple cycles per year, that spread widens.
HVAC cost spillover from inefficient lighting
This is where poor comparisons go off the rails. Nearly all fixture input power ends up as heat in the room. LEDs do not eliminate heat. They change where and how heat appears. Purdue, Cornell CEA, and Michigan State material all make this point in different ways: LEDs tend to emit less radiant heat toward leaf surfaces than HID, but the room still has to deal with the electrical load as heat.
That matters because cooling cost tracks lighting inefficiency. If one fixture draws 350 extra watts to deliver the same photons, that 350 watts becomes extra heat load during operation. Over the same 84-day example above, the HPS used 411.6 more kWh than the LED. That is 411.6 kWh of additional heat dumped into the room before you even account for ballast inefficiency or distribution effects.
If the HVAC system needs roughly 0.3 to 0.5 extra kWh of cooling energy to remove each added kWh of lighting heat, that spillover can add another 123 to 206 kWh per cycle in this example. At $0.25/kWh, that is another $30.75 to $51.50 per fixture per cycle. Hot climates, sealed rooms, and high latent loads can push the penalty higher.
This is one reason Fluence and other industry studies often report lower total facility energy demand under LED than HPS. Manufacturer data should not be treated as neutral academic evidence, but on this point the building physics are not controversial.
When a cheaper fixture becomes more expensive to operate
The break-even question is straightforward: how many cycles does it take for lower operating cost to erase the higher upfront price?
Suppose Fixture A is a lower-priced HPS setup at $400 and Fixture B is a higher-priced LED at $900. The LED costs $500 more upfront. But each cycle it saves:
- $102.90 in direct lighting electricity at $0.25/kWh
- $40 in avoided bulb replacement and maintenance, averaged per cycle
- $40 in reduced cooling energy
That is about $182.90 saved per cycle. The extra upfront cost is recovered in under three cycles.
Even at cheaper electricity, the math can still favor LED over time. If power is $0.12/kWh and cooling demand is modest, maybe the per-cycle savings fall to $90 to $120. The payback is slower, but still real for a room that runs continuously. If electricity is expensive, or if the room needs heavy air conditioning, cheap fixtures stop being cheap very quickly.
This is why capex versus opex has to be tied to photon delivery. A low-efficacy fixture can look attractive only when you ignore runtime, lamp depreciation, replacement parts, and HVAC. Once those enter the ledger, the fixture with the higher purchase price often has the lower total cost per delivered mole of photons across a year. That is the number that matters.
Best-practice lighting layouts for indoor cannabis cultivation
Room layout is where lighting theory stops being abstract. A fixture can post an impressive efficacy number and still perform badly over a real cannabis canopy if the map is uneven, the edges are dark, or the aisles eat a third of the photons. Bruce Bugbee’s repeated point at Utah State is the right one to carry into room design: plants respond to photons delivered over area and time, not to marketing labels, wattage, or a single center reading.
The useful question is not “How strong is this light?” It is “What PPFD distribution reaches the actual leaf surface, for how many hours, at what heat cost?”
Single-fixture tents versus multi-fixture rooms
In a tent, one fixture often has to do everything: hit target PPFD, cover the corners, and stay far enough away to avoid a bright central hotspot. That makes fixture geometry more important than raw output. A small tent with one intense point source can show a great center reading and still under-light the perimeter by a wide margin. Cannabis plants at the edges then lag in flower initiation, internode control, and final density. The center looks fine. The room average does not.
Single-fixture tents usually benefit from broad, rectangular emission patterns rather than concentrated beams. In practice that means a distributed LED fixture often fits tents better than a compact puck or HID bulb unless the canopy footprint is very small. Raise the light too high, though, and wall losses rise while average PPFD falls. Lower it too much and uniformity collapses. Michigan State extension materials from Erik Runkle and colleagues have long stressed that greater hanging distance can improve uniformity, but only by trading away intensity. That trade has to be measured, not guessed.
Multi-fixture rooms change the problem. Here, the goal is not one lamp covering a footprint; it is many fixtures creating controlled overlap. Done well, overlap smooths out valleys between units and makes the room less sensitive to plant height variation. Done badly, it creates stripes of excess light under every fixture and dim troughs between them.
A simple rule helps: design around the crop area only, then account explicitly for non-crop space. A 20-by-20 room is not a 400-square-foot canopy if benches, drains, and aisles reduce plant area to 280 square feet. Lighting the whole shell as if it were filled wall to wall wastes photons and inflates cooling load. The National Academies reported in 2023 that electric lighting can account for 20% to 50% of indoor farm energy use depending on system design and climate. Layout mistakes show up on the power bill fast.
Bar-style LED layouts and canopy uniformity
Bar-style LEDs dominate modern indoor cannabis for a reason: they spread diodes over a large plane, which reduces hotspot intensity and improves edge-to-edge consistency. That is not spectral magic. It is geometry.
A bar fixture works best when its shape matches the canopy shape. Long rectangular canopies want long rectangular photon sources. Square flowering tables want either square fixtures or evenly tiled bars. In both cases, the target is a flatter PPFD map, not the highest center number. A room averaging 850 µmol/m²/s with tight uniformity is usually more productive than one peaking at 1,300 in the middle and falling to 450 at the edges, especially at ambient CO2 where many cannabis flowering canopies perform well in roughly the 700 to 1,000 µmol/m²/s range.
Spacing matters between fixtures as much as hanging height above plants. Leave too much gap and inter-fixture valleys form. Pack fixtures too tightly and overlap becomes wasteful, driving up top-leaf stress and HVAC burden. Modern LED efficacy helps here. The DLC’s 2025 horticultural threshold of 2.30 µmol/J is a practical floor, and many strong fixtures exceed 3.0 µmol/J. That efficiency edge over legacy HPS is real, but it does not mean “LEDs run cool.” Nearly all input power still ends up as heat in the room. The difference is that LEDs usually deliver less radiant heat straight to leaves and distribute fixture heat differently, a point echoed in Purdue, Cornell CEA, and DOE materials.
Map bar layouts with a grid, not a single sensor reading under the center bar. Measure corners, edges, and the spaces between fixtures at canopy height. Average them. Then check minimum and maximum values. That tells you whether the crop sees a workable lighting field.
Point-source HID layouts and overlap planning
HID fixtures, especially double-ended HPS, behave differently because they are stronger point sources. They can still grow excellent cannabis. The penalty is lower efficacy and harder uniformity management. DOE SSL materials place common HPS efficacy around 1.6 to 1.9 µmol/J, versus more than 3.0 µmol/J for current high-end LEDs. In a sealed room, that gap affects both fixture energy and cooling demand.
With point sources, overlap planning is everything. The instinct to center each HID over a notional square can backfire because inverse-square falloff creates bright circles directly below the lamp and weaker edges between lamps. Cary Mitchell at Purdue and other controlled-environment educators have spent years correcting this mistake in greenhouse and indoor layouts: point sources need intentional cross-coverage.
That usually means hanging somewhat higher than beginners expect and spacing fixtures so neighboring footprints intersect before PPFD collapses. Reflectors matter as well. A wide reflector can improve lateral spread, but if the room is narrow or aisles are large, much of that spread lands somewhere without leaves. Again, map the crop zone rather than admiring the peak under the bulb.
Reflective surfaces, wall losses, and room geometry
Walls are not neutral. They either return escaped photons to the canopy or absorb them. Flat white paint is often more useful than people assume because it reflects broadly and avoids some of the wrinkle, dust, and hotspot issues seen with low-grade reflective films. Highly reflective surfaces help most at the perimeter, where edge plants otherwise receive less direct light than central plants.
Edge management is one of the least discussed parts of cannabis lighting. The outer 6 to 18 inches of a canopy often set the true room average. If the edges are weak, the room is weak. Tents partly mask this by placing reflective walls close to the crop, but larger rooms expose every gap in fixture spacing and every poorly used aisle.
Room geometry decides whether photons stay productive. Long narrow rooms often perform better with multiple linear fixtures running parallel to the canopy rows. Square rooms can tolerate more symmetric grids. Ceilings that are too low limit the ability to use hanging height as a uniformity tool, which is one reason bar LEDs fit low rooms better than intense point sources.
Do not trust a center-point PPFD claim. Build a measurement grid across the whole canopy, including corners and borders, at the height of the top leaves. Then redesign spacing, dimming, or fixture count until the map matches the crop, the photoperiod, and the heat capacity of the room. That is what turns lighting science into a working cannabis layout.

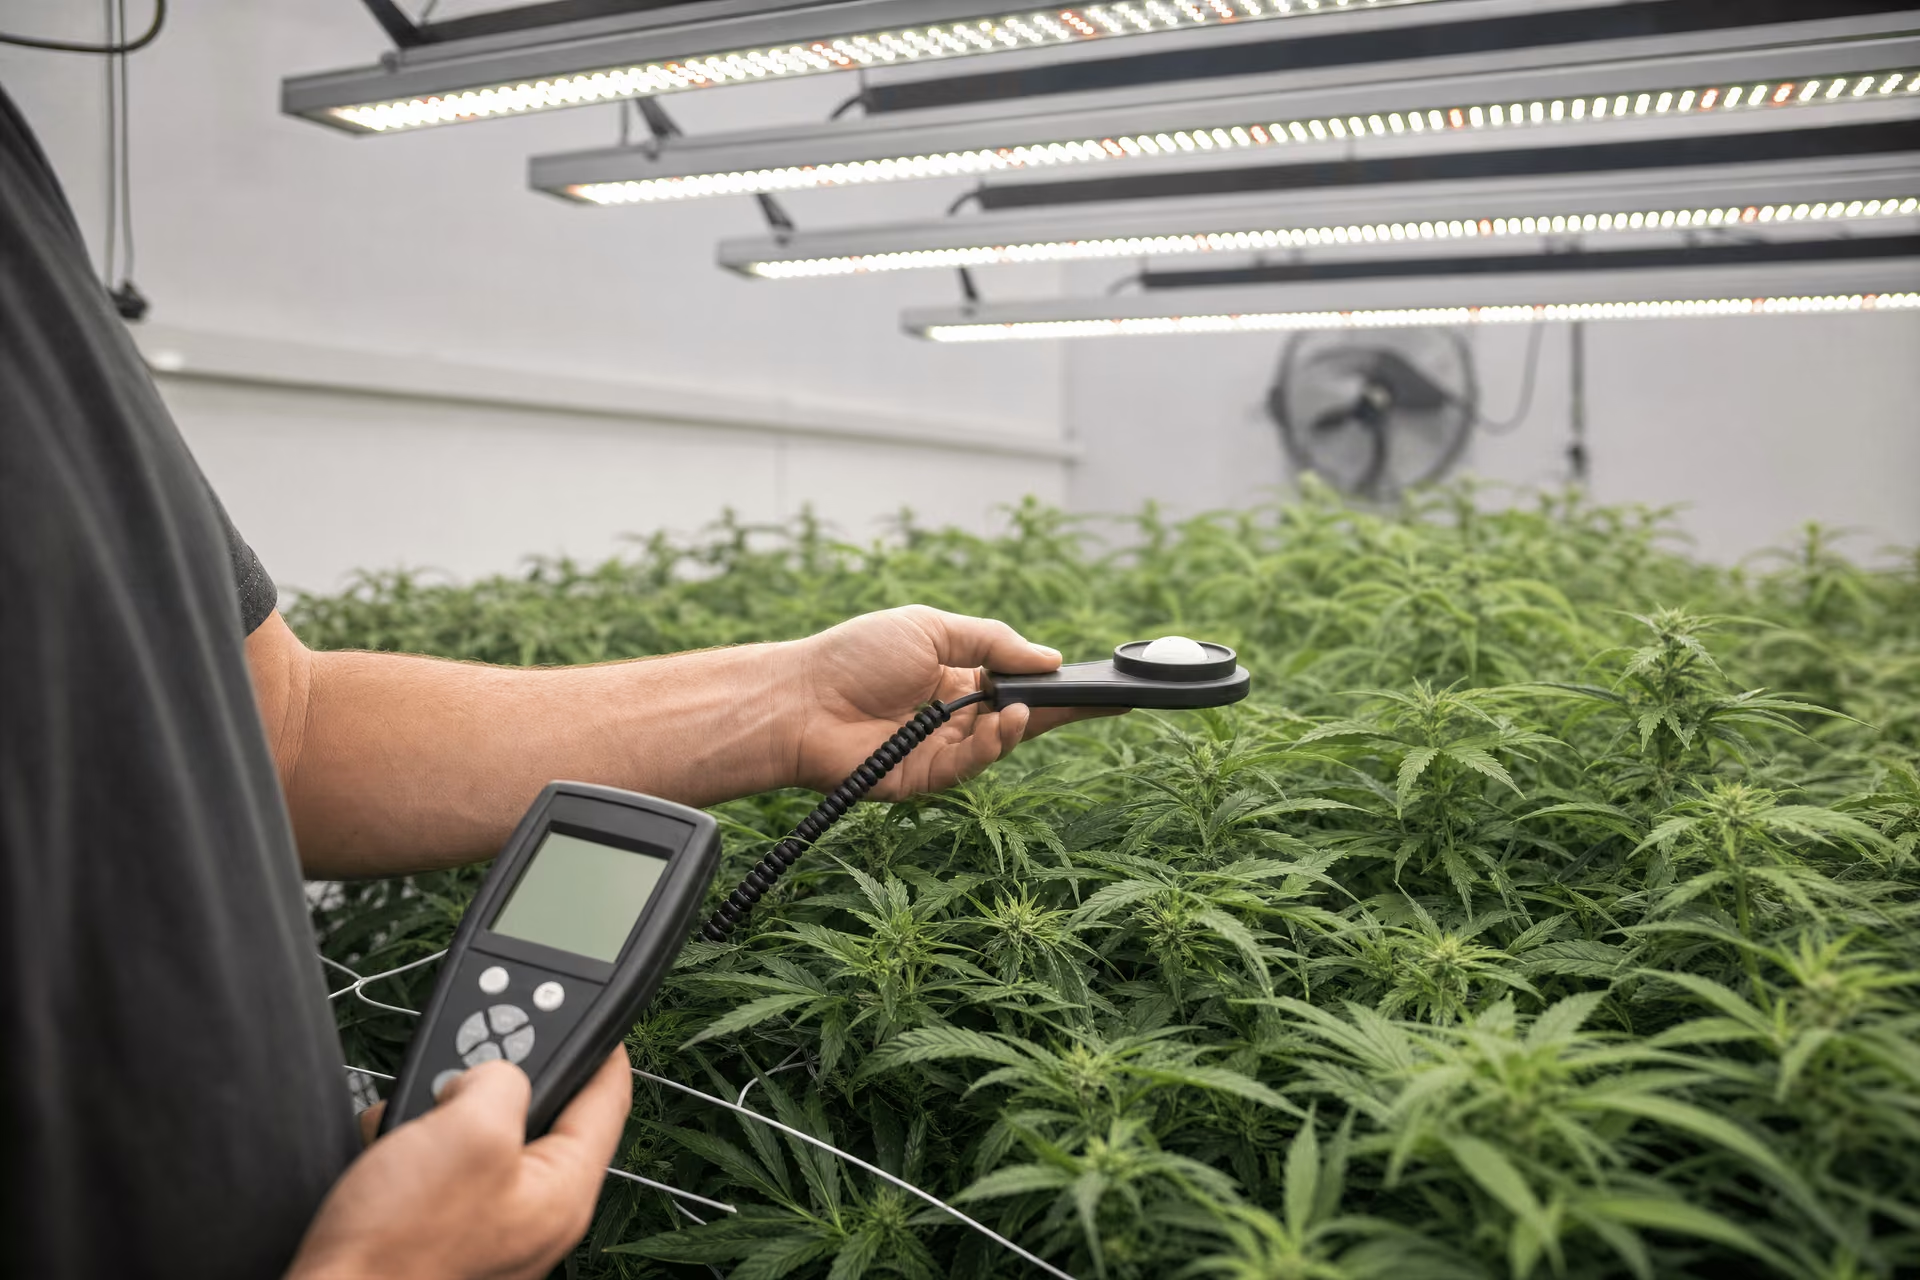
Measurement tools, calibration, and troubleshooting bad lighting decisions
The fastest way to make an expensive lighting mistake is to trust labels, wattage, or someone else’s hanging-height rule instead of measuring what reaches the canopy. Bruce Bugbee at Utah State has hammered this point for years: plants respond to photons delivered over time, not to brand stories about “penetration” or magic color mixes. If you do not know canopy PPFD, uniformity, photoperiod, and resulting DLI, you are guessing.
That matters because indoor cultivation is electrically hungry. Mills estimated in Energy Policy (2012) that indoor cannabis production used about 1% of total U.S. electricity at the time, and the 2023 National Academies report on controlled-environment agriculture put electric lighting at roughly 20% to 50% of total energy use in indoor farms depending on system design and climate. Bad lighting decisions are not just agronomic mistakes. They are operating-cost mistakes.
Quantum sensors, PAR meters, and app-based estimates
A proper quantum sensor measures photosynthetic photon flux density, usually in µmol/m²/s, across the 400–700 nm range used in standard PAR accounting. Better modern instruments may also address ePAR concepts out to 750 nm, which matters if a fixture includes meaningful far-red. The key point is not the acronym. It is calibration.
A real quantum sensor or a well-validated PAR meter is designed to count photons, not to estimate human-visible brightness. That is why it can read a white LED fixture and a red-heavy horticultural fixture more reliably than a phone app. Phone cameras and lux apps are built around photopic vision, which weights green heavily because that is how human eyes work. Plants are not human eyes. A lux reading can be loosely useful only when comparing similar white spectra with known conversion factors. It falls apart when spectrum shifts, especially with older red-blue “blurple” fixtures.
App-based estimates are not worthless. They are just lower-confidence tools. If your only options are a phone app or no measurement at all, the app can sometimes tell you whether one corner of the canopy is much dimmer than another. It cannot replace a calibrated quantum sensor when you are deciding whether the canopy average is 450, 750, or 1,050 µmol/m²/s. Those are very different regimes.
Calibration drifts over time. Sensors should be kept clean, checked against known references when possible, and used consistently: same measurement plane, same orientation, enough points across the canopy to catch edge loss and center hot spots. One center reading is not a lighting plan. It is a comfort blanket.
How to read manufacturer PPFD charts critically
Manufacturer PPFD maps are useful, but only if you read the fine print first. Most are generated under ideal conditions: a specified mounting height, an open test area or reflective room assumption, a fresh fixture, and a flat measurement grid with no plants disrupting airflow or light distribution. Your room is almost never that room.
How manufacturer PPFD charts can mislead
- Average PPFD can hide poor uniformity caused by center hotspots and weak edges.
- Quoted mounting height may not match your optics, tent size, dimming level, or canopy shape.
- PPFD charts rarely show what the fixture does to leaf temperature and room cooling demand.
Three things usually get hidden by pretty heatmaps.
First, average PPFD can conceal poor uniformity. A fixture with a high center value and weak edges may look impressive on a chart because the average is inflated by a hotspot. Michigan State and Purdue extension materials have long stressed that fixture spacing and mounting height affect uniformity as much as raw intensity. Raising a fixture often lowers peak PPFD while improving spread. That can increase canopy-wide performance even if the headline number drops.
Second, mounting height is not universal. The common advice to hang a fixture at one fixed distance is lazy. Optics, fixture geometry, tent size, wall reflectivity, plant architecture, and dimming level all change the answer. A bar-style LED over a full canopy behaves differently from a point-source HID or a compact board fixture.
Third, charts rarely tell you what happens to leaf temperature and room cooling load. “LEDs run cool” is a half-truth that causes bad HVAC planning. LEDs send less radiant heat toward leaves than HPS, yes. But most input wattage still ends up as room heat. The difference is where the heat goes and how the room handles it, not whether heat exists.
Read PPFD maps like a skeptic. Check the measurement grid dimensions. Check fixture height. Check whether the chart reports average only or min/max values too. Then verify in your own space.
Diagnosing under-lighting, over-lighting, and spectral myths
When plants stretch in vegetative growth, the first suspect is usually too little PPFD or poor canopy distribution, not a missing secret wavelength. Measure the canopy. If average veg PPFD is below roughly 300–600 µmol/m²/s for an 18-hour schedule, your DLI may be short. Utah State’s DLI framing makes this obvious: 600 µmol/m²/s for 18 hours gives 38.9 mol/m²/day, while 500 for 18 gives 32.4. That gap matters.
If plants bleach, taco, or show top-canopy stress, do not jump straight to nutrient theories. Check intensity, fixture distance, and leaf temperature first. At ambient CO2, many flowering canopies perform well around 700–1,000 µmol/m²/s. Push materially above that without matching CO2, irrigation, nutrition, and temperature control, and returns often diminish while stress risk rises. More light is not automatically more yield.
If plants overheat, remember that the issue may be total room heat load, not just fixture-to-leaf distance. Lowering fixture power and improving air exchange may solve more than simply raising the light. Cornell CEA and Purdue resources both point to the difference between radiant heat and room heat: HID often heats leaf surfaces more directly, while LEDs change the leaf-air relationship and can alter transpiration patterns at the same dry-bulb temperature.
If plants stall with dark, hardened leaves and no obvious bleaching, consider whether DLI is too high for the root zone, watering schedule, or CO2 level. Light drives demand. If the rest of the system cannot keep up, growth can flatten.
And the spectral myth needs to die: spectrum can fine-tune morphology and secondary responses, but it does not rescue inadequate intensity. Far-red and UV are tools, not substitutes for enough photons in the main photosynthetic range. Bugbee has been especially blunt on this point, and he is right.
A practical decision framework for choosing the right system
Start with the canopy target, not the fixture category. Define your intended PPFD and photoperiod by growth stage, then calculate DLI:
DLI = PPFD × 3,600 × photoperiod hours ÷ 1,000,000
For veg, 300–600 µmol/m²/s over 18 hours gives about 19.4–38.9 mol/m²/day. For flowering at ambient CO2, 600–1,000 over 12 hours gives about 25.9–43.2. If you plan to run enriched CO2 and stronger climate control, higher numbers can make sense. If not, chasing them is often wasted power.
Then compare fixtures by efficacy and coverage. The DLC’s 2025 horticultural threshold is 2.30 µmol/J for many listed luminaires, while strong modern fixtures often exceed 3.0 µmol/J. DOE materials place many HPS systems well below that, commonly around 1.6–1.9 µmol/J for double-ended units. That gap shows up on the utility bill and in cooling demand.
Lighting system decision checklist
- Can this fixture deliver the target PPFD evenly across the whole canopy?
- Can the room remove the heat it adds?
- Can the crop actually use the planned DLI under your CO2, irrigation, and nutrition regime?
- Can you verify performance with measurement rather than assumption?
After that, ask four plain questions:
1. Can this fixture deliver the target PPFD evenly across the whole canopy? 2. Can the room remove the heat it adds? 3. Can the crop actually use the planned DLI under your CO2, irrigation, and nutrition regime? 4. Can you verify performance with measurement rather than assumption?
If plants stretch, increase canopy PPFD or improve distribution first. If tops bleach, dim or raise the fixture first. If the room overheats, address total load and airflow before blaming “hot LEDs” or “cool LEDs.” If flowering goes wrong after a light-cycle change, check dark-period integrity too; cannabis flowering depends on uninterrupted night signaling through phytochrome, so light leaks matter more than many beginner guides admit.
The theme is simple and unfashionable: measurement literacy beats marketing. Not wattage. Not blurple. Not a fixed hanging height copied from a forum. Measure the canopy, calculate DLI, read PPFD charts skeptically, and adjust from plant response backed by data. That is how bad lighting decisions stop repeating themselves.
References
- [1] Daily Light Integral: A Research Review and High-Resolution Maps of the United States. HortTechnology, 2015. https://doi.org/10.21273/HORTTECH.25.6.669
- [2] The carbon footprint of indoor Cannabis production. Energy Policy, 2012. https://doi.org/10.1016/j.enpol.2012.03.041